Cloud gaming, i.e., real-time game playing via thin clients,
relieves players from the need to constantly upgrade their computers and
deal with compatibility issues when playing games.
As a result, cloud gaming is generating a great deal of interest among
entrepreneurs and the public. However, given the large design space, it
is not yet known which platforms deliver the best quality of service and
which design elements constitute a good cloud gaming system.
This study is motivated by the question: How good is the
real-timeliness of current cloud gaming systems? To address the
question, we analyze the response latency of two cloud gaming platforms,
namely, OnLive and StreamMyGame. Our results show that the streaming
latency of OnLive is reasonable for real-time cloud gaming, while that of
StreamMyGame is almost twice the former when the StreamMyGame server is
provisioned using an Intel Core i7-920 PC.
We believe that our measurement approach can be generally applied to
PC-based cloud gaming platforms, and that it will further the
understanding of such systems and lead to improvements.
Thin clients have become increasingly popular in recent years, primarily
because of the high penetration rate of broadband Internet access and the
use of cloud computing technology to build large-scale data centers. The
massive computation and storage resources of data centers enable users to
shift their workload to remote servers. As a result, thin clients are
more convenient and also more powerful (with the supply from remote
servers) than traditional fat clients. Thus, today, it is not uncommon
for people work and play by accessing remote computers via thin clients.
Although the advantages of thin clients have been demonstrated in many
applications, computer games in particular have benefited from the
advances in the thin client technology.
One of the reasons is that the overhead of setting up a game can
be significant because game software is becoming increasingly complex. As
a result, players are often restricted to one computer and cannot play
games anywhere, anytime. In addition, trying a new game can be difficult
because there may have software and hardware compatibility issues
between the game and players' computers. Hence, players may be faced
with a dilemma of whether to upgrade their computers or forgo the
opportunity to try a new game.
Cloud gaming, i.e., real-time game playing via thin
clients, offers solutions for all the above-mentioned issues. Cloud
gaming frees players from the need to constantly upgrade their computers
as they can now play games that host on remote servers with a broadband
Internet connection and a thin client. Here a thin client can be a
lightweight PC, a TV with a set-top box, or even a mobile device.
Consequently, there are no set up overheads or compatibility issues if
players wish to try a game because all the hardware and software is
provided in the data centers by the game operators.
Given these potential advantages for both game developers and consumers,
cloud gaming has been seen a possible paradigm that would change the way
computer games are delivered and played.
However, realizing the concept of cloud gaming is not a trivial
task because of the following strict requirements: 1) Gaming
requires a high level of graphical quality. For example, HDTV
video modes, such as 720p (1280x720 pixels) and 1080p
(1920x1080 pixels), are now supported by a number of console
platforms (e.g., Playstation 3 and Xbox 360) and video games on
PC. 2) High responsiveness (i.e., short response delay) is
essential to ensure the quality of gaming experiences. For
example, first-person shooter games normally require a response
time of less than 100 ms so that the players are not aware of
network lags and remain immersed in the game
world [3]. Fulfilling
either of the above requirements may not be difficult;
however, it is quite challenging (and also resource-intensive)
to deliver both high-definition and low-latency cloud
gaming services to players. In the case of first-person shooter
games, satisfying both requirements implies that the rendering,
encoding, transmission, decoding, and display of every
high-definition game frame (preferably at the rate of 60 frames
per second) need to be completed in less than 100-d ms,
assuming that transmitting user's actions from the client to
the server takes d ms.
Cloud gaming has already generated a great deal of interest among
entrepreneurs, venture capitalists, and the general public. Several
startup companies offer or claim to offer cloud gaming services, such as
OnLive1,
StreamMyGame2,
Gaikai3,
G-Cluster4,
OTOY5, and
T5-Labs6, though their
realizations may be very different. Some of the services are only
accessible via thin clients on a PC (either native or browser-based
applications), while others can be accessed via a TV with a set-top box.
Quite a few design alternatives can be adopted when implementing a cloud
gaming service, such as 1) the way the existing game software is modified
and run on the server; 2) the way the game screen is encoded (on the
server) and decoded (on the client); 3) the way game streaming data is
delivered to the client; and 4) the way short-term network instability is
handled to maintain the game's responsiveness and graphical quality.
Because of the large design space of such systems, it is not yet
known which platforms deliver the best quality of service and which
design elements constitute a good cloud gaming system.
In this paper, we perform an anatomic analysis of the latency of two
cloud gaming platforms, namely, OnLive and StreamMyGame. We chose them
because they were the only PC-based cloud gaming platforms on the market
at the time of writing (April 2011). Measuring the latency of cloud
gaming systems is challenging because most of the systems are
proprietary and closed, i.e., none of the source codes and
internals of the cloud servers, game software, and thin clients are
available. In addition, cloud servers and the game software running on
them cannot be modified because they are managed centrally by the service
operators. Despite of these restrictions, we propose a measurement
methodology that can assess the delay components of a cloud gaming system
even if the system is proprietary and closed. To the best of our
knowledge, this work is the first to anatomically analyze the delay
components of cloud gaming systems.
Our study is mainly motivated by the
question: How good is the real-timeliness of current cloud gaming
systems? It raises the following more specific questions, which we
attempt to answer through empirical performance analysis:
What are the traffic characteristics of cloud gaming
services?
How responsive are cloud gaming services? How long does it
take such services to encode a game screen in real time?
How good is the graphical quality provided by cloud gaming
services? To what extent is the service quality dependent on network
conditions?
Our contribution of this work is two-fold: 1) We propose a methodology for measuring the latency of cloud gaming
systems. It can be applied even if the system is closed and not modifiable. 2) We profile two commercial cloud gaming platforms, OnLive and
StreamMyGame, and show that the streaming latency of OnLive is reasonable
for real-time cloud gaming, while that of StreamMyGame is almost twice
the former when the StreamMyGame server is provisioned using an Intel
Core i7-920 (2.66 GHz) PC.
The remainder of this paper is organized as follows. The next section
provides a review of related works.
We present our measurement methodology and the measured results in
Section 3.
Section 4 contains our concluding remarks.
This study is associated with research in two areas: measuring
the performance of thin clients and designing thin clients for
remote gaming. In this section, we consider a number of works
on the above topics.
Nieh and Laih [8] proposed using slow-motion benchmarking to evaluate the performance of several thin
client platforms on various tasks. Unfortunately, the technique cannot be
applied to cloud gaming systems because games would have to be modified
so that they could run in slow motion. Besides, the performance metrics
used, i.e., the amount of data transferred, are not sufficient to
accurately assess the temporal and spatial quality of cloud gaming
services.
Wong and Seltzer [12] evaluated the
performance of Windows NT Terminal Service when serving multi-user
accesses. The study focused on the server's usage of the processor,
memory, and network bandwidth. The authors also measured the latency
introduced by the scarcity of the server's resources. More recently,
Tolia et al. [11] quantified user-perceived
latency when using a number of applications via
VNC [10], a popular open-source and
platform-independent thin client.
A number of thin client architectures have been proposed to support
real-time graphical applications, or more specifically, computer
gaming [9,7,4,6,5].
They can be divided into two categories. The first
type [9,7,5]
transmits 2D/3D graphics drawing instructions from the server to the
client and leaves the client to render the graphics themselves, while the
second
type [4,6]
streams rendered graphics as real-time video. The former requires less
bandwidth to deliver screen updates; in contrast, the latter is much less
platform- and implementation-dependent and less demanding of the client's
resources (because all the rendering tasks are tackled by the server). To
the best of our knowledge, all current commercial cloud gaming platforms
employ the second (video streaming) approach, possibly because of the
above characteristics.
This work complements the above studies in that it proposes a
measurement methodology for the instrumentation of
streaming-based thin client platforms. The methodology can be
used even if the platforms are closed and not modifiable for
instrumentation purposes.
When OnLive was introduced at the Game Developer's
Conference in 2009, it attracted a significant amount of attention from
the mass media and the public. The service is well-known partly because
of its high-profile investors and partners, including Warner Bros, AT&T,
Ubisoft, Atari, and HTC. It was released in June 2010 and now offers more
than 120 games as of September 2011. OnLive's client is available on
Microsoft Windows, Mac OS X, and as a TV set-top box. The minimum bandwidth requirement is 3 Mbps, but
an Internet connection of 5 Mbps or faster is recommended. All the games
are delivered in HDTV 720p format.
Unlike OnLive, which hosts game servers in its own data centers,
StreamMyGame (SMG) offers software solutions for remote
game playing. The service was launched in October 2007 and currently
supports more than 120 games from Windows to Windows- and Linux-based
clients as of September 2011. It supports game streaming in a variety of
resolutions, from 320x240 to 1920x1080 (1080p), which require an Internet
connection between 256 Kbps (320x240) and 30 Mbps (1080p). Although
StreamMyGame offers a software-based platform rather than a centralized
service, we consider it a perfect fit for this present study because we
focus on the performance of game streaming mechanisms rather than the
capacity of service providers.
Because of the architectural differences of OnLive and SMG, their system
configurations in our experiments are not identical. The main difference
is that the OnLive server is operated by OnLive Inc., while the SMG server is operated by ourselves
and installed with the SMG server software developed by Tenomichi/SSP
Ltd. For a fair comparison, the OnLive client and SMG server/client are
running on desktop computers equipped with two Intel Core i7-920
processors running at 2.66 GHz; in addition, both platforms are
configured to provide remote gaming in 1280x720 resolution with same 3D
effect settings.
We used three games, namely, Lego Batman: The Videogame (Batman),
Warhammer 40,000: Dawn of War (DOW), and F.E.A.R. 2: Project Origin
(FEAR) in this work. We chosen the games because they are supported by
both platforms and they represent three game genres. Lego Batman is an
action-adventure game, FEAR is a typical first-person shooter (FPS) game,
and Warhammer is a real-time strategy (RTS) game. FPS games normally
require a high rate of game screen updates, whereas the pace of adventure
and RTS games is relatively slower with an omnipresent
viewpoint [3].
Becaue of the architectural differences of OnLive and SMG, the
configurations of the platforms are not identical. The main
difference is that the OnLive server (both the hardware and
software) is operated by OnLive Inc., while SMG provides a
software-only solution. Thus, the SMG server we used is
operated by ourselves and installed with the SMG server
software developed by Tenomichi/SSP Ltd.
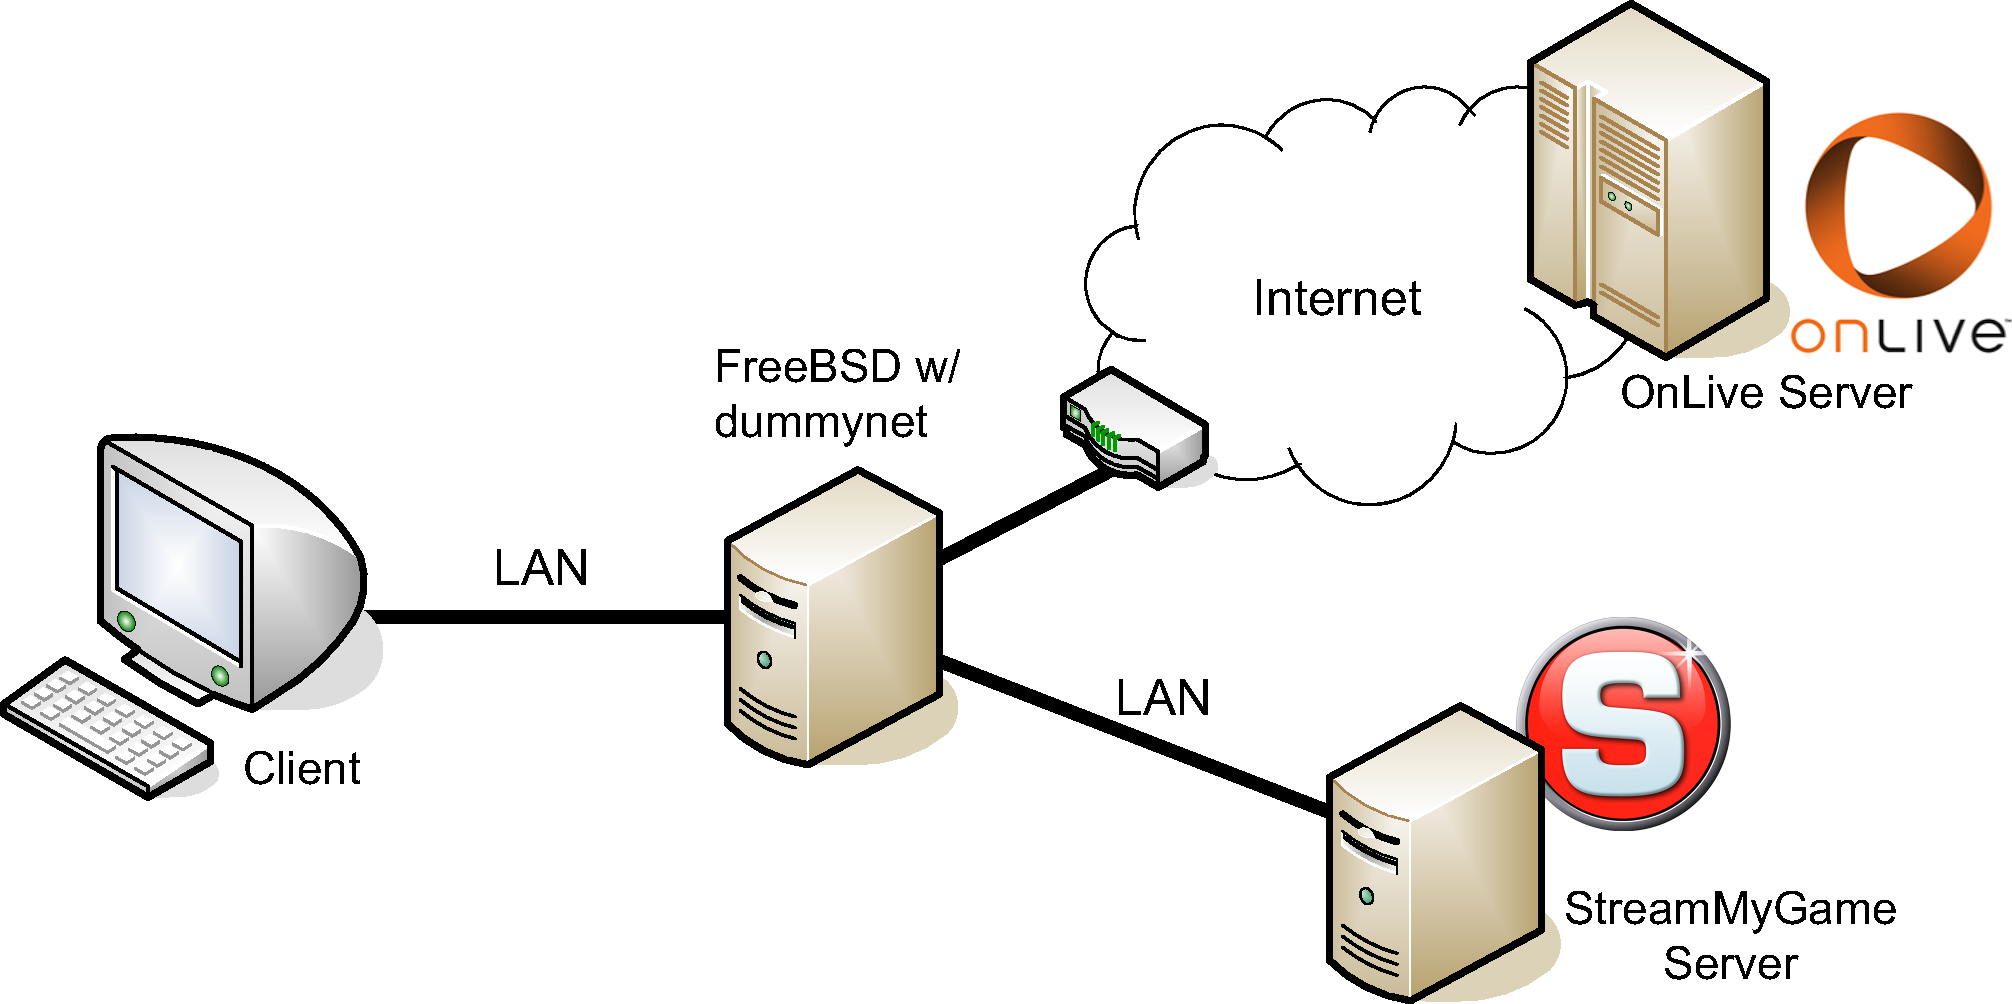
We set up three PCs, a client, a router, and an SMG server, in
a Gigabit Ethernet LAN. In the OnLive experiments, the client
runs the OnLive client, which connects to the OnLive server
remotely through the router. In the SMG experiments, the client
runs the SMG client, and connects to the SMG server via the
router. Hereafter, "the server" refers to the SMG server in
our LAN in the SMG experiments or to the OnLive server
connected by the client in the OnLive experiments. The router
runs on FreeBSD 7.0 with dummynet, which we use to
inject network quality degradations between the client and the
server. Both the client and the server are equipped with an
Intel Core i7-920 processor running at 2.67GHz and installed
with Microsoft Windows 7, which is supported by the OnLive
client, SMG client, and SMG server. To ensure that the
comparison is fair, the games are streamed at a resolution of
1280x720 in all the experiments.
Because the OnLive server is outside our LAN, we cannot fully
control the quality of the network path between our client and
the OnLive server. Fortunately, the quality of the path was
consistently good during our experiments. The network delay of
the path was around 130 ms without much fluctuations (e.g.,
the standard deviation of the round-trip times were mostly less
than 5 ms for 100 successive ICMP ping measurements
with 1 Hz sampling frequency). The path capacity allows OnLive
to transmit 5 Mbps of gaming content to our client without a
noticeable rate of packet loss. The ICMP ping
measurements taken at 1 Hz during all the OnLive experiments
showed that the overall packet loss rate was less than
10−6. Therefore, we can take the advantage of the
consistently lightly-loaded path between the OnLive server and
our OnLive client by considering the path as a communication
channel with more than necessary available bandwidth, zero
packet loss, and a constant 130 ms latency. In
Section 3, we show that our delay measurement
methodology is effective in the presence of network delay
between the client and the server as long as the delay variance
is small.
Figure 1: The network topology of our experiments.
In this section, we analyze the delay components in the
response times of cloud gaming services. First, we explain our
measurement methodology and then apply it to OnLive and SMG
with the three genres of games discussed earlier.
We segment a cloud gaming system's response delays (RD) to players'
commands into three components:
spacing
Network delay (ND): the time required to deliver a
players' command to the server and return a game screen to the client. It
is usually referred to as the network round-trip time (RTT).
Processing delay (PD): the difference between the time the
server receives a player's command (from the client) and the time it
responds with a corresponding frame after processing the command.
Playout delay (OD): the difference between the time the
client receives the encoded form of a frame and the time the frame is
decoded and presented on the screen.
Basically, the response delay (RD) equals the sum of the
network delay, the processing delay, and the playout delay.
Unlike the network delay, which can be measured using tools
like ICMP ping, the processing delay (at the server)
and playout delay (at the client) occur internally in
the cloud gaming system and are not accessible from outside.
Our goal is to measure both delays accurately by using only
external probes.
The methodology comprises the following steps, which we discuss
in Section 3.4,
Section 3.5,
Section 3.6 respectively.
measure the response delay of a cloud gaming system to a
user's input;
calibrate the measured response delay by individual games'
characteristics;
decompose the calibrated response delay into the delay
components.
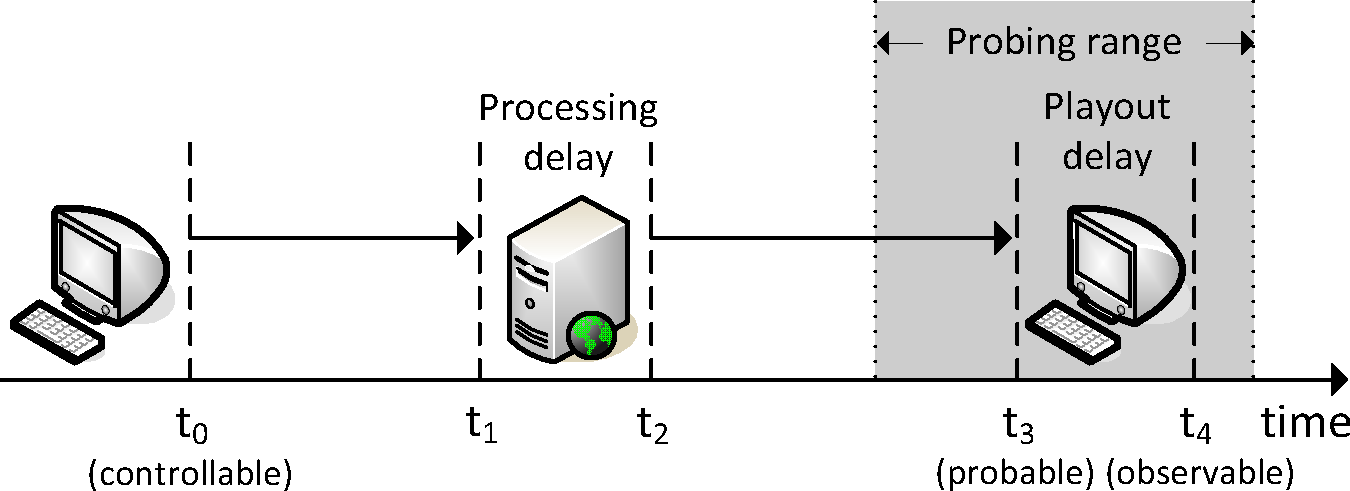
Figure 2: The key events in the measurement of the response delay of
a cloud gaming platform by invoking the menu screen.
To measure the response delay (RD), which equals to ND+PD+OD, of a cloud
gaming system, we exploit the fact that most games support a hot key,
which is used to access a menu screen anytime during game play. The key
is usually the ESC key for computer games and the START
button for console games. Without loss of generality, we assume the ESC
key is the hot key for invoking the menu screen. As illustrated in
Figure 2, assuming the ESC key is pressed at time t0
and the menu screen is shown to the user at time t4, the time
difference (t4−t0) corresponds to the response delay of the ESC key.
However, the processing delay (t2−t1) and the playout delay
(t4−t3) are not visible and cannot be measured directly.
To determine the response delay, we utilize the hooking
mechanism7 in Windows to inject our instrumentation code
into the OnLive and SMG clients. We use the detours library to
intercept the IDirect3dDevice9::EndScene() function,
which is called when a Direct3D application finishes drawing graphics on
a hidden surface and is about to present the surface on the screen.
We then use the following procedure to measure the response delay:
Simulate an ESC key press event by calling the
SendInput() function at time t0.
Each time the game screen is updated, we examine the colors of a
specific set of pixels to determine if the menu screen is displayed.
Wait until the menu screen appears (and note the time as t4).
We can therefore calculate the response delay by subtracting t0 from
t48.
Each run of the procedure yields a sample of the response delay; thus, we
can repeatedly execute the procedure to obtain a set of response delay
samples.
Ideally, the response delay should be the sum of the network delay,
processing delay, and playout delay; that is,
RD=ND+PD+OD.
(1)
However, the equation is not totally correct because a game may
intentionally postpone the appearance of the menu screen for a short
period of time after the ESC key is pressed. Since the delay is
introduced by game software rather than cloud gaming platforms, we call
it the "game menu delay (GMD)." To take account of GMD, we need to
rewrite Equation 1 as
RD=ND+PD+OD+GMD
(2)
in order to accurately reflect the components in the measured response
delay.
To calibrate the response delay, we measure the game menu
delays of the three games (i.e., Batman, FEAR, and DOW) by
applying the same function hooking technique to the PC versions
of the games. The measurement procedure is similar to that for
measuring the response delay except that the game software,
instead of the thin client, is hooked and monitored. Our
procedure repeatedly invoked the menu screen and computed the
game menu delays of the three games. As a result, we obtained
the average game menu delays for Batman, DOW, and FEAR as 3 ms,
27 ms, and 536 ms, respectively. The measurements were
repeated for more than 10,000 times for each game. The game
menu delays were fairly stable, as the standard deviations of
the delays was only 1 ms, 9 ms, and 14 ms respectively.
Figure 3: The decomposition of the response delay. The gray area
represents the range in which the recv() call may be started to
be blocked in order to probe the exact location of
t3.
During the experiments, we periodically measure the network round-trip
time using ICMP ping as ND samples. Since we have ND and the
sum of ND, PD, and OD constitutes the response delay,
we only need to determine either PD (processing delay) or OD (playout
delay) in order to decompose all the components. More specifically, we
need to further determine the occurrence of t3 (shown in
Figure 3) in order to obtain PD and OD.
The rationale behind probing t3 is that it is the time the menu screen
delivered to the client from the server. Thus, if incoming data is
(intentionally) blocked (by us) on the client earlier than t3, the
menu screen will not be shown until the blocking is cancelled. On the
other hand, if incoming data is blocked later than t3, the menu screen
will be displayed despite that no further screen updates are received and
shown as long as the incoming data blocking is sustained.
To facilitate the data blocking mechanism, we hook the
recvfrom() function, which is called when the thin clients
attempt to retrieve a UDP datagram from the UDP/IP stack. The
measurement procedure is as follows:
Simulate an ESC key press event by calling the
SendInput() function at time t0. Also, compute tblock
as a random time between RD−100 ms and RD+50 ms9,
assuming the playout delay shorter than 100 ms.
If the menu screen appears before tblock, record the time as
tmenu and terminate the procedure. Otherwise, at tblock,
temporarily block all the subsequent recvfrom() calls for one
second10.
Wait until the menu screen appears (and note the time as
tmenu).
If tmenu is later than tblock+1 sec, we consider that
the blocking is successful and t3 should be some time later than
tblock. In this case, tblock is added to the set tblock_succeeded.
On the other hand, if tmenu is earlier than tblock, we consider
that the blocking is failed and t3 must be some time earlier than
tmenu. In this case, tmenu is added to the set tblock_failed. By
repeating the procedure a number of times, we can obtain a set
tblock_succeeded that are earlier than t3, and another set tblock_failed that
are later than t3, where t3 must lie approximately at the boundary
of the two sets.
We then estimate t3 as the point that yields the minimum sum of the
two density functions formed by tblock_succeeded and tblock_failed respectively,
where each density function is computed as the mixture of the Gaussian
density functions centered at each element with a standard deviation of
any reasonable magnitude11. After estimating t3,
we can compute PD (server processing delay) as t3−t0−ND and OD
(playout delay) as t4−t3.
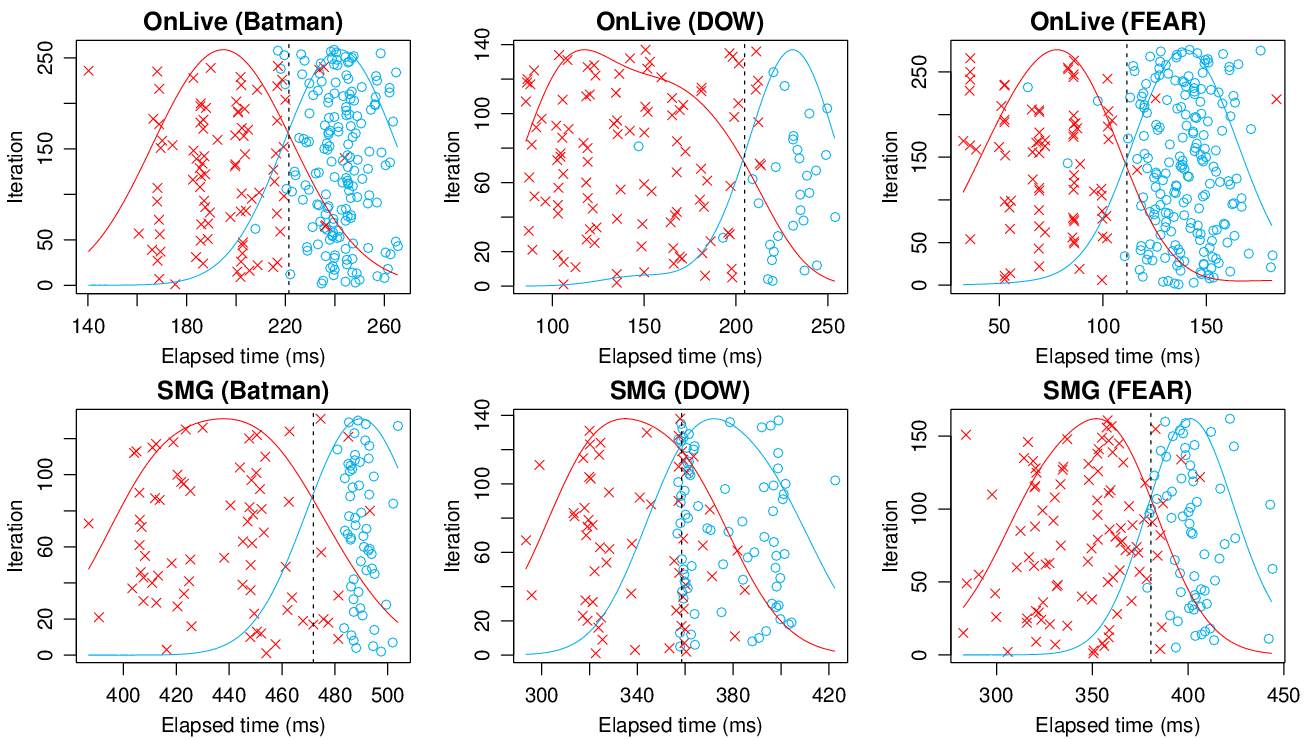
Figure 4: The scatter plots of tblock_succeeded and tblock_failed samples, denoted by red crosses and blue circles respectively. The
vertical dashed lines denote the estimates of t3 minus the network
delay.
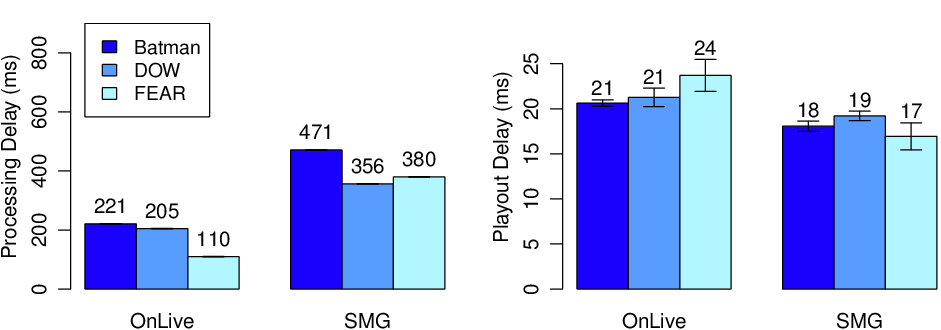
Figure 5: The estimated processing delays and playout delays of
both cloud gaming platforms.
Figure 4 shows the scatter plots of tblock_succeeded and
tblock_failed samples, denoted by red crosses and blue circles
respectively. Note that we have subtracted all the samples by ND in
order to remove the effect of network delay between our PC and the OnLive
data center.
We can observe that the ranges of tblock_succeeded and tblock_failed sets are
not disjoint. This is reasonable because there may be fluctuations in the
server's and client's workloads, and the network delay may vary due to
network congestion. Because t3 (and consequently PD and OD) are
inferred based on a set of iterations, we validate the robustness of
t3 by cross-validation. That is, instead of using the data from all
iterations, we select 50 iterations at random and use them to estimate
t3. The procedure is repeated at least 30 rounds. If the estimated
values for t3 in different rounds are close, we can confirm that the
estimated PD and OD are reliable and not susceptible to measurement
noises.
Figure 5 shows the average processing delays and playout
delays as well as their 95% confidence bands of OnLive and SMG when
Batman, DOW, and FEAR are played.
As can be seen, the confidence bands of both processing and playout
delays are fairly small, which indicates that our proposed measurement
technique produces robust estimates of the delay components.
From the graph, OnLive's processing delays are approximately half of
those of SMG. This should be because OnLive utilizes a more efficient,
possibly hardware-based, H.264 encoder to encode game screens in real
time. It could also simply because the processing power of our SMG server
is much lower than that of the OnLive server.
Taking a closer look at OnLive, its processing delay is approximately 200
ms for Batman and DOW and 100 ms for FEAR. We consider FEAR's shorter
processing delay is an intentional arrangement by OnLive because FPS
games are known especially susceptible to
lags [3,1], and the
shorter delay may be the consequence of using higher-performance
servers12
for the game. Considering action and RTS games are slower-paced, OnLive's
differential resource provisioning looks a reasonable strategy to provide
an overall satisfactory gaming experience to
players [2].
As to the average playout delays of both platforms, OnLive spends 20-30
ms and SMG spends ≈ 15-20 ms in frame decoding and display. Both
systems perform similarly well in this aspect, as such short playout
delays would not have a serious impact on the gaming experience.
To summarize, OnLive's overall streaming delay (i.e., the processing
delay at the server plus the playout delay at the client) for the three
games is between 135 and 240 ms, which is acceptable if the network delay
is not significant. On the other hand, real-time encoding of 720p game
frames seem to be a burden to SMG on an Intel i7-920 server because the
streaming delay can be as long as 400-500 ms. Investigating whether the
extended delay is due to design/implementation issues of SMG or it is an
intrinsic limit of software-based cloud gaming platforms will be part of
our future work.
In this paper, we have proposed a general methodology to measure the
latency components of cloud gaming systems, even those that are
proprietary and closed. We applied the methodology on two platforms,
OnLive and StreamMyGame, and identified that OnLive implements a
game-genre-based differential resource provisioning strategy to provide
sufficiently short latency for real-time gaming. On the other hand,
StreamMyGame takes almost twice latency to provide 720p real-time game
graphics with an Intel Core i7-920 PC, which leaves us an issue to
investigate whether the extended delay is due to an intrinsic limit of
software-based cloud gaming systems.
In our future work, we will continue to improve the applicability and
accuracy of the proposed methodology. In addition, we plan to apply the
methodology to more platforms for understanding their strengths and
weaknesses, and derive general guidelines for designing quality cloud
gaming systems.
D. De Winter, P. Simoens, L. Deboosere, F. De Turck, J. Moreau, B. Dhoedt, and
P. Demeester.
A hybrid thin-client protocol for multimedia streaming and
interactive gaming applications.
In Proceedings of ACM NOSSDAV 2006, pages 15:1-15:6. ACM,
2006.
O.-I. Holthe, O. Mogstad, and L. A. Rønningen.
Geelix livegames: remote playing of video games.
In Proceedings of IEEE CCNC 2009, pages 758-759. IEEE Press,
2009.
A. Jurgelionis, P. Fechteler, P. Eisert, F. Bellotti, H. David, J. P.
Laulajainen, R. Carmichael, V. Poulopoulos, A. Laikari, P. Perälä,
A. De Gloria, and C. Bouras.
Platform for distributed 3d gaming.
Int. J. Comput. Games Technol., 2009:1:1-1:15, January 2009.
I. Nave, H. David, A. Shani, Y. Tzruya, A. Laikari, P. Eisert, and
P. Fechteler.
Games@Large graphics streaming architecture.
In IEEE International Symposium on Consumer Electronics 2008.
IEEE, 2008.
A. Y.-l. Wong and M. Seltzer.
Evaluating windows NT terminal server performance.
In Proceedings of USENIX Windows NT Symposium, pages 15-15.
USENIX Association, 1999.
Footnotes:
1http://www.onlive.com/2http://www.streammygame.com/3http://www.gaikai.com/4http://www.gcluster.com/5http://www.otoy.com/6http://www.t5labs.com/7The Windows hooking mechanism is invoked by calling
the SetWindowsHookEx function. It is frequently used to inject
code into other processes.
8Certain games, such as FEAR, intentionally postpone the
appearance of the menu screen for a short period of time. Thus, we have
calibrated the response delays by subtracting the intentional menu
appearance delay from the measured delays obtained using the procedure.
9The 50-ms
interval is chosen arbitrarily in order to leave a "safe zone" that
ensures the menu screen will be blocked with a non-zero probability.
10The one-second interval is chosen arbitrarily in order to
determine whether or not the menu screen is blocked. Other values can
also apply without affecting the measurement results.
11In our experiment, we use a standard
deviation of 20 ms; however, other values of the same order of magnitude
would yield nearly identical t3 estimates.
12http://blog.onlive.com/2009/05/12/hopping-through-cloud-onlive/