Online gaming is one of the most profitable businesses on the
Internet. Among various threats to continuous player subscriptions,
network lags are particularly notorious. It is widely known that
frequent and long lags frustrate game players, but whether the
players actually take action and leave a game is unclear. Motivated
to answer this question, we apply survival analysis to a
1,356-million-packet trace from a sizeable MMORPG, called ShenZhou Online.
We find that both network delay and network loss significantly
affect a player's willingness to continue a game. For ShenZhou Online, the
degrees of player "intolerance" of minimum RTT, RTT jitter, client
loss rate, and server loss rate are in the proportion of
1:2:11:6. This indicates that 1) while many network games
provide "ping time," i.e., the RTT, to players to facilitate
server selection, it would be more useful to provide information
about delay jitters; and 2) players are much less tolerant of
network loss than delay. This is due to the game designer's decision
to transfer data in TCP, where packet loss not only results in
additional packet delays due to in-order delivery and retransmission,
but also a lower sending rate.
Human Factors, Internet Measurement, Network Games, Quality of Service, Survival Analysis
1 Introduction
The prevalence of MMORPGs (Massive Multiplayer Online Role Playing
Games) has broadened the definition of network games. Until
recently, most real-time interactive network games were distributed
and peer-to-peer; and no more than several dozen players could
participate in a game at any time. Nowadays, however, it is not
uncommon to have thousands of participants playing in an MMORPG
world simultaneously.
The MMORPG business also plays an important part in the economic
well being of the Internet.
The MMORPGs have generated 5 billion US dollars of business
worldwide in 2004 and the market is expected to double by
2009 [9]. Among various threats to continuous player
subscriptions, network lags are particularly notorious. It is widely
known that frequent or long lags frustrate game players but whether
the players will take action and leave a game remains unclear. This
work is dedicated to answer this question.
Online games in general have been considered QoS-sensitive Internt
applications [13] and there have been studies,
although no one consensus reached, on the QoS-sensitivity of FPS
(First-Person Shooting) games, RTS (Real Time Strategy) games,
sports games, and car racing
games [11,[18,[3,[16,[2,[17,[13] (cf. Section II-A). MMORPGs are
different in that there are no explicit victories or defeats,
scores, or rankings, and the playing time is a more appropriate
indicator of the player's gaming experience. Therefore, in this
attempt to understand MMORPG players' QoS-sensitivity, we ask the
question: "Once a player is in a game, how does network QoS
affect his decision to continue or leave the game?" This work is,
as far as we know, the first quantitative analysis on the
relationship between network QoS and online game playing times.
In this paper, we analyze the lifetimes of game sessions derived
from ShenZhou Online[20], a commercial MMORPG. Using a survival
analysis approach, we investigate the relationship between network
QoS and session times. Although, logically, the relation of cause
and effect cannot be clarified from a cross-sectional study, we
assume the correlation between game session times and network QoS
implies that premature departures are caused by unfavorable network
experience. The major findings are as follows. First, we show that
both network delay and network loss significantly affect
players' willingness to continue a game or leave it, whereas
earlier studies indicate that players have remarkable tolerance of
unfavorable network
conditions [11,[3,[18].
Second, while many network games provide "ping time," i.e. the
round trip time (RTT), to players to facilitate server selection, we
show that the delay jitters are more important than absolute delays
in terms of playing time. Therefore, in addition to the "ping
time," its variations should also be considered in the server
selection process.
Third, quantitatively, the degrees of player "intolerance"
to minimum RTT, RTT jitter, client loss rate, and server loss rate
are in the proportion of 1:2:11:6. To be specific, a
player's decision to leave a game due to unfavorable network
conditions is based on the following levels of intolerance: client
packet loss (55%), server packet loss (30%), RTT fluctuations
(10%), and minimum RTT (5%). While most QoS-sensitivity
studies focus on the impact of delay, we argue that delay jitters
and the packet loss (error) rate are more important, since, from our
modeling, absolute delay times only contribute 1/20 of the
influence on average to the QoS-intolerance of MMORPG players.
Furthermore, we believe that only considering transit delay times
and the different characteristics of transport protocols used, e.g.,
TCP or UDP, could be the major reasons for the inconsistent results
of earlier works.
The remainder of this paper is organized as follows.
Section II describes related works and the design
of the game ShenZhou Online. We present the measurement methodology,
preprocessing, and a summary of the game traffic trace in
Section III. In Section IV, we
explain why we adopt survival analysis and present a summary of this
methodology. In Section V, we analyze the
general lifetime patterns exhibited by game sessions, and confirm
the correlation between network QoS and session duration. Next, in
Section VI, we develop a lifetime model that
describes the relationship between QoS covariates and game session
times. We then discuss the model's results and implications.
Finally, in Section VII, we present our
conclusions.
2 Background
2.1 Related Work
In the QoS spectrum of network applications, realtime interactive
network games are generally considered QoS-sensitive. Although a QoS
infrastructure is not widely available on the Internet, network
games are already prevalent. The reason is that either QoS is
unnecessary, or players usually struggle with adverse network
conditions. Motivated by the question, Henderson and Bhatti
conducted controlled experiments to examine the QoS tolerance of
network game players [13]. They found that degraded
QoS affects whether a user joins a game in the first place; however,
once a user is in a game, the decision to leave is not significantly
related to increased network delay. Henderson and Bhatti also found
that the effect of network delay is outweighed by game design or
exogenous effects, and players seem to be remarkably tolerant of
network conditions [11]. The impact of network
conditions on different game genres has been investigated in many
ways. Armitage, for example, suggests that players prefer the
Quake 3 server with a ping time of 150 to 180
milliseconds [2]. Beigbeder et al. find that
typical ranges of packet loss and latency do not significantly
affect the outcome of the game in Unreall Tournament
2003[3]. Sheldon et al. conclude that, overall,
high latency has a negligible effect on the outcome of
Warcraft III[18]. In [16],
Nichols and Claypool show that user performance is degraded by
almost 30% for latencies higher than 500 ms in NFL
Football. While most previous works suggest remarkable QoS
tolerance on the part of game players, our results show that both
network latency and network loss have a significant influence on
game playing times in MMORPG.
The modeling of player lifetime is one of the important aspects in
characterizing network gaming traffic. Henderson and Bhatti model
session durations in Quake and Half-Life as an
exponential distribution, the only constant failure-rate lifetime
distribution [12]. On the other hand, the
duration of Half-Life game sessions is closely fitted to a
Weibull distribution in [4]. The authors
attribute the inconsistent results to the influence of various game
add-ons. Our modeling differs from earlier works in that it
incorporates network QoS factors as predictors, which
transforms it into a (multiple) regression problem of lifetime
hazard functions. As a result, we can assess the influence of
individual network QoS factors on game session times.
2.2 Design of ShenZhou Online
Figure 1: A screen shot of ShenZhou Online
ShenZhou Online is a mid-scale, commercial MMORPG in Taiwan [20].
There are thousands of players online at any time. To play,
participants must purchase "game points" either from a convenience
store or online. A screen shot of ShenZhou Online is shown in
Fig. 1. The character played by the author is the
man in the center of the screen and with a smiling face above his
head. He is in a market place, where other players keep stalls. As
is typical of an MMORPG, the players can engage in fights with
random creatures, train themselves in particular skills, participate
in marketplace commerce, or take on a quest.
ShenZhou Online is provided through a number of independent game sets, each of
which is equivalent in content, but isolated. The reason for
providing identical game sets is to distribute the workload over a
number of servers with limited game content, e.g., terrain,
missions, and creatures in the virtual world.
A game set is logically a "game server" from the view point of
players. Each game set comprises an entry server, several map
servers, and a
database server.
The entry server guards the entrance to the game world, and game
clients must connect to it first to "recall" the specified
character from the database before their adventure. The game world
is partitioned into a number of maps, provided by several map
servers. When a character moves across map boundaries, if the new
map is provided by a different map server, the game client will
disconnect from the original map server and establish a connection
with the new map server. In addition, since a credit account is
allowed to own up to four characters in each game set, players may
switch to another character during the game. The difference between
a "character switch" and a "map switch" is that clients must
contact the entry server to save and load character data in the
former case, while switching maps does not require contact with the
entry server.
Based on the above-mentioned mechanisms, we define three types of
session: 1) map session: the period a character remains on a
map; 2) role session: the period the same character is used;
and 3) game session: the period a player remains in a game.
Since we focus on the time players have been in the game, i.e., the
duration of game sessions, only game sessions are considered in the
rest of this paper. For brevity, we use "session" to denote game
session(s), unless otherwise stated.
ShenZhou Online uses TCP as its network transport protocol. Although TCP is not
designed for real-time communication, it has not been proved as yet
whether it is suitable for MMORPG message transmission. However,
from our analysis, TCP's loss recovery mechanism makes packet loss
the major component of those disturb game play, whereas the
situation could be relieved by using a more lightweight protocol
which only recovers dropped packets whenever necessary.
3 Trace Description
In this section, we first describe the setup and network topology of
the traffic measurement. We then address the method to infer game
sessions from the packet-level trace.
Finally the extracted game sessions are summarized.
3.1 Measurement Setup
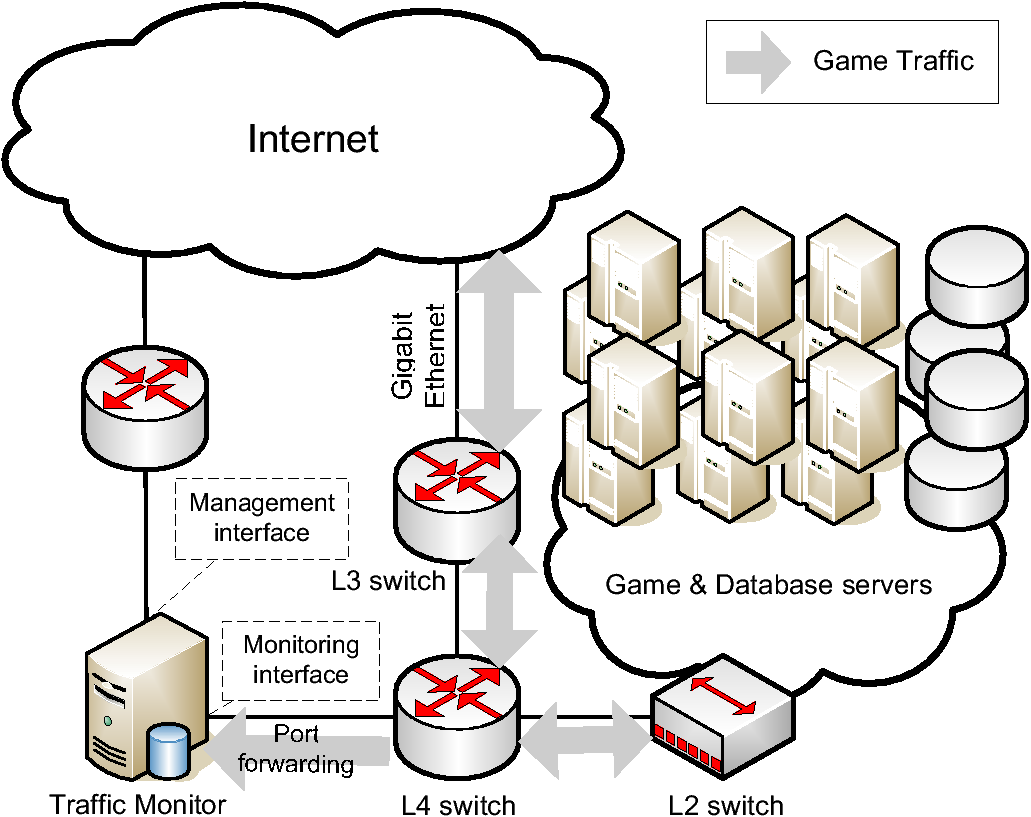
Figure 2: Network setup and topology of the network
monitor
To properly evaluate the relationship between game playing times and
network conditions, a packet-level trace is necessary to infer QoS
metrics, such as packet delay times and packet loss rates. With the
assistance of ShenZhou Online staff, we set up a traffic monitor alongside the
game servers. The traffic monitor is attached to a layer-4 switch
upstream of the LAN containing the game servers (we call it the
"game LAN"). The "port forwarding" capability of the tapped
switch is enabled so that all inbound/outbound game traffic is
forwarded to our monitor as a copy. To minimize the impact of
monitoring, all remote management operations are conducted via an
additional network path, i.e., the game traffic and management
traffic do not interfere with each other. The network configuration
of the game servers and the traffic monitor is depicted in
Fig. 2. The traffic monitor is a FreeBSD PC
equipped with Pentium 4, 1.5 GHz and 256 MB RAM. We use
tcpdump with kernel built-in BPF to obtain traffic traces.
Because of the restrictions of the network topology, the switch
forwards all traffic sent to and from the game LAN to the monitor,
including non-game-playing traffic such as HTTP, DNS and SMB
packets. These unwanted traffic types are filtered out using the
filtering support of tcpdump. Due to data privacy and storage
considerations, only IP and TCP headers are recorded.
Owing to the large volume of game traffic, logging only packet
headers takes less than three hours to fill up our 70 GB hard
disk; however, a three-hour trace is too short for a lifetime
analysis as the average session time of MMORPGs is between
70-120 minutes according to statistics from
Japan [1]. To prolong the trace time, we randomly
choose a subset of game sets for each trace-only packets
corresponding to the selected game sets are logged. We then take two
packet traces, N1 and N2, to record traffic for two- and
three-game sets, respectively. Since each game set is identical in
content and configuration, we assume players in different game sets
do not exhibit significantly different behavior. We purposely
captured two traces (one on a Sunday and one on a Monday) and took
them as representatives of lifetime patterns on weekends and
weekdays, respectively. A summary of the traffic traces is listed in
Table I.
Table 1: Summary of Game Traffic Traces
Trace
Sets
Date
Time
Period
Drops
Conn.
Pkt. (in / out / both)
Bytes (in / out / both)
N1
3
8/29/04 (Sun.)
15:00
8 hr.
0.003%
57,945
342M / 353M / 695M
4.7TB / 27.3TB / 32.0TB
N2
2
8/30/04 (Mon.)
13:00
12 hr.
?†
54,424
325M / 336M / 661M
4.7TB / 21.7TB / 26.5TB
† The drop count reported by tcpdump is zero, but we actually found some packets are dropped at the monitor.
3.2 Session Composition
From the packet trace, we can easily identify a map session since it
is semantically equivalent to a TCP connection. Unfortunately, a
game session cannot be easily recognized because it involves a set
of connections. However, as we know the game's design, we can obtain
game sessions by the following composition rules:
If the intervals between adjacent map sessions of a game
client are less than 30 sec, and no "character switch" request
intervenes, the map sessions are combined to form a role session.
If the intervals between adjacent role sessions of a game
client are less than 120 sec, the role sessions are combined to form
a game session.
The thresholds, 30 sec and 120 sec, are conservative estimates so
that most map switches and character switches are finished in the
interval. We note that different threshold values do not noticeably
affect our modeling, since only a few sessions involve long-duration
map or character switches.
Table 2: Summary of Game Sessions
Trace
# Sess.
# Cens.
Min.
Median†
Max.
N1
7,597
3,331 (44%)
27 sec
122 min
487 min
N2
7,543
1,774 (24%)
22 sec
86 min
729 min
Total
15,140
5,105 (34%)
22 sec
100 min
729 min
† Estimated with the Kaplan-Meier curve (Equation 1).
Table 3: Summary of Network Performance Experienced by Game Sessions
Trace
RTTmin
RTTmean
RTTmax
RTTsd
Lossclient†
Lossserver†
Losstotal†
N1
48.8 ms
176.8 ms
839.0 ms
63.4 ms
0.13% / 57.9% / 46.2%
0.10% / 27.0% / 61.3%
0.08% / 35.5% / 64.1%
N2
49.3 ms
176.4 ms
792.3 ms
61.9 ms
0.12% / 62.5% / 48.3%
0.10% / 18.5% / 61.5%
0.08% / 50.1% / 64.8%
Total
49.1 ms
176.6 ms
815.7 ms
62.6 ms
0.12% / 62.5% / 47.2%
0.10% / 27.0% / 61.4%
0.08% / 50.1% / 64.5%
† The format of these columns:
"geometric mean / maximum / percentile of sessions with at least
one packet loss."
3.3 Trace Summary
We summarize the derived game sessions in
Table II. A total of 15,140 sessions were
observed with 5,105 sessions censored. The median session time of
100 minutes agrees with the statistics in [1], which
reports the average session time is around 70-120 minutes for a
number of Korean MMORPGs played in Japan.
The round-trip times and packet loss rates for game sessions are
listed in Table III. The average RTT of around 180
ms looks reasonable for playing MMORPGs [13].
However, 10% of the sessions experienced an average loss rate
≥ 1%, and 3% of the sessions had a loss rate ≥ 5%.
Does such a degree of loss influence players to continue a game or
leave it? To answer this question, in the later sections, we
progressively demonstrate how players' game times are related to
their network experiences.
4 Methodology
In this paper, we analyze the relationship between game playing
times and network QoS by a survival analysis
approach [14]. We adopt this statistical methodology
for two reasons: 1) a significant number (34%) of observed
sessions are censored, i.e., only a portion of a session's
duration is observed by our measurement, while methods in survival
analysis are capable of handling such uncertainty; and 2) the
relationship between game playing times and network QoS can be
properly assessed by a transformation to a (multiple) regression
problem, which corresponds to the notable Cox Proportional Hazards
model [7] in survival analysis.
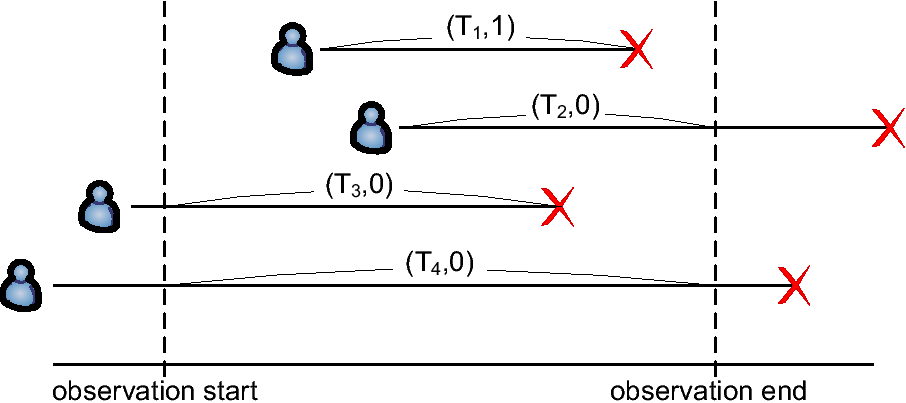
Figure 3: Our measurement setup leads to explicit censoring
of game sessions. The four possible censoring scenarios are depicted
with notation (t, s), where t is the observed duration and s
is the censoring status.
Even though our traces take 8 and 12 hours respectively, 34%
of the sessions are censored. Since game servers shutdown and carry
out maintenance on a daily basis, we argue that the censoring
of sessions is inevitable, either explicitly or implicitly. Our
approach leads to explicit censoring, i.e., sessions are censored by
the choice of trace periods (see Fig. 3). On the
other hand, if we take traces over an entire day, players are
implicitly censored by the prearranged daily shutdown. In
this scenario, some players may leave the server ahead of the
scheduled shutdown, while others may stay until they are forcibly
disconnected. For example, if the server shuts down at 11:00 AM, a
player who leaves at 10:30 may be due to the daily maintenance or
other reasons. Because of the uncertainty of implicit censoring, we
use explicit censoring as it reflects the "true" censoring status
more accurately.
By the conventions of survival analysis, we denote a player's
departure as an event or a failure. An indicator
variable, si, the censoring status, is used to indicate whether a
session, i, is censored: thus si=1 means an event has occurred
(not censored) and vice versa, as illustrated in
Fig. 3.
A survival function is commonly used to describe the lifetime
pattern of an object or a set of observations. In our context, the
survival function is defined as:
S(t)
=
Pr
(asessionthatsurviveslongerthantime t)
=
1−
Pr
(asessionthatfailsbefore,
orisequaltotime t)
=
1−F(t),
where F(t) is the cumulative distribution function (CDF) of
session times. A standard estimator of the survival function,
proposed by Kaplan and Meier [15], is called the
Product-Limit estimator or the Kaplan-Meier estimator. Suppose there
are n distinct session times t1, t2, …, tn in ascending
order such that t1 < t2 < … < tn, and that at time ti
there are di events and Yi active sessions. The estimator is
then defined as follows for all values of t ≤ tn:
^
S
(t)
=
∏ti ≤ t
Pr
[T > ti |T ≥ ti ]
=
⎧ ⎪ ⎨
⎪ ⎩
1
if t < t1,
∏ti ≤ t [1 −
di
Yi
]
if t1 ≤ t.
For observations with ties, if the times are continuous in essence
and later discretized by measurement, which is the case with game
session times, a practical solution is to add a small amount of
"noise" so that all times are unique. Following the estimate of
the survival function, the pth quantile of the lifetime, tp,
can then be obtained by
tp=
inf
{t:
^
S
(t) ≤ 1−p}.
(1)
We use this equation repeatedly to estimate the median session
time as t0.5 for a group of sessions.
In addition to the survival function, a frequently used quantity in
survival analysis is the hazard function, or the hazard
rate. It is also known as the conditional failure rate in
reliability engineering, or the intensity function in stochastic
processes. The hazard rate is defined by
h(t) =
lim
∆t → 0
Pr
[t ≤ T < t + ∆t|T ≥ t]
∆t
.
A related quantity is the cumulative hazard function H(t) which is
defined by
H(t) =
⌠ ⌡
t
0
h(u)du = − ln[S(t)].
The hazard function gives the instantaneous rate at which
failures occur for observations that have survived at time t. The
quantity h(t)∆t may therefore be seen as the
approximate probability that a player who has been in a game
for time t will leave the game in the next ∆t period,
given that ∆t is small. The hazard function plays an
important role in the Cox regression model in that the hazard rate
of session times h(t) is taken as the response variable of network
QoS factors, as we shall discuss in Section VI.
5 Session Characteristics
In this section, we first examine the day of the week effect. We
then clarify the correlation between game playing times and network
QoS by correlational plots and statistical tests.
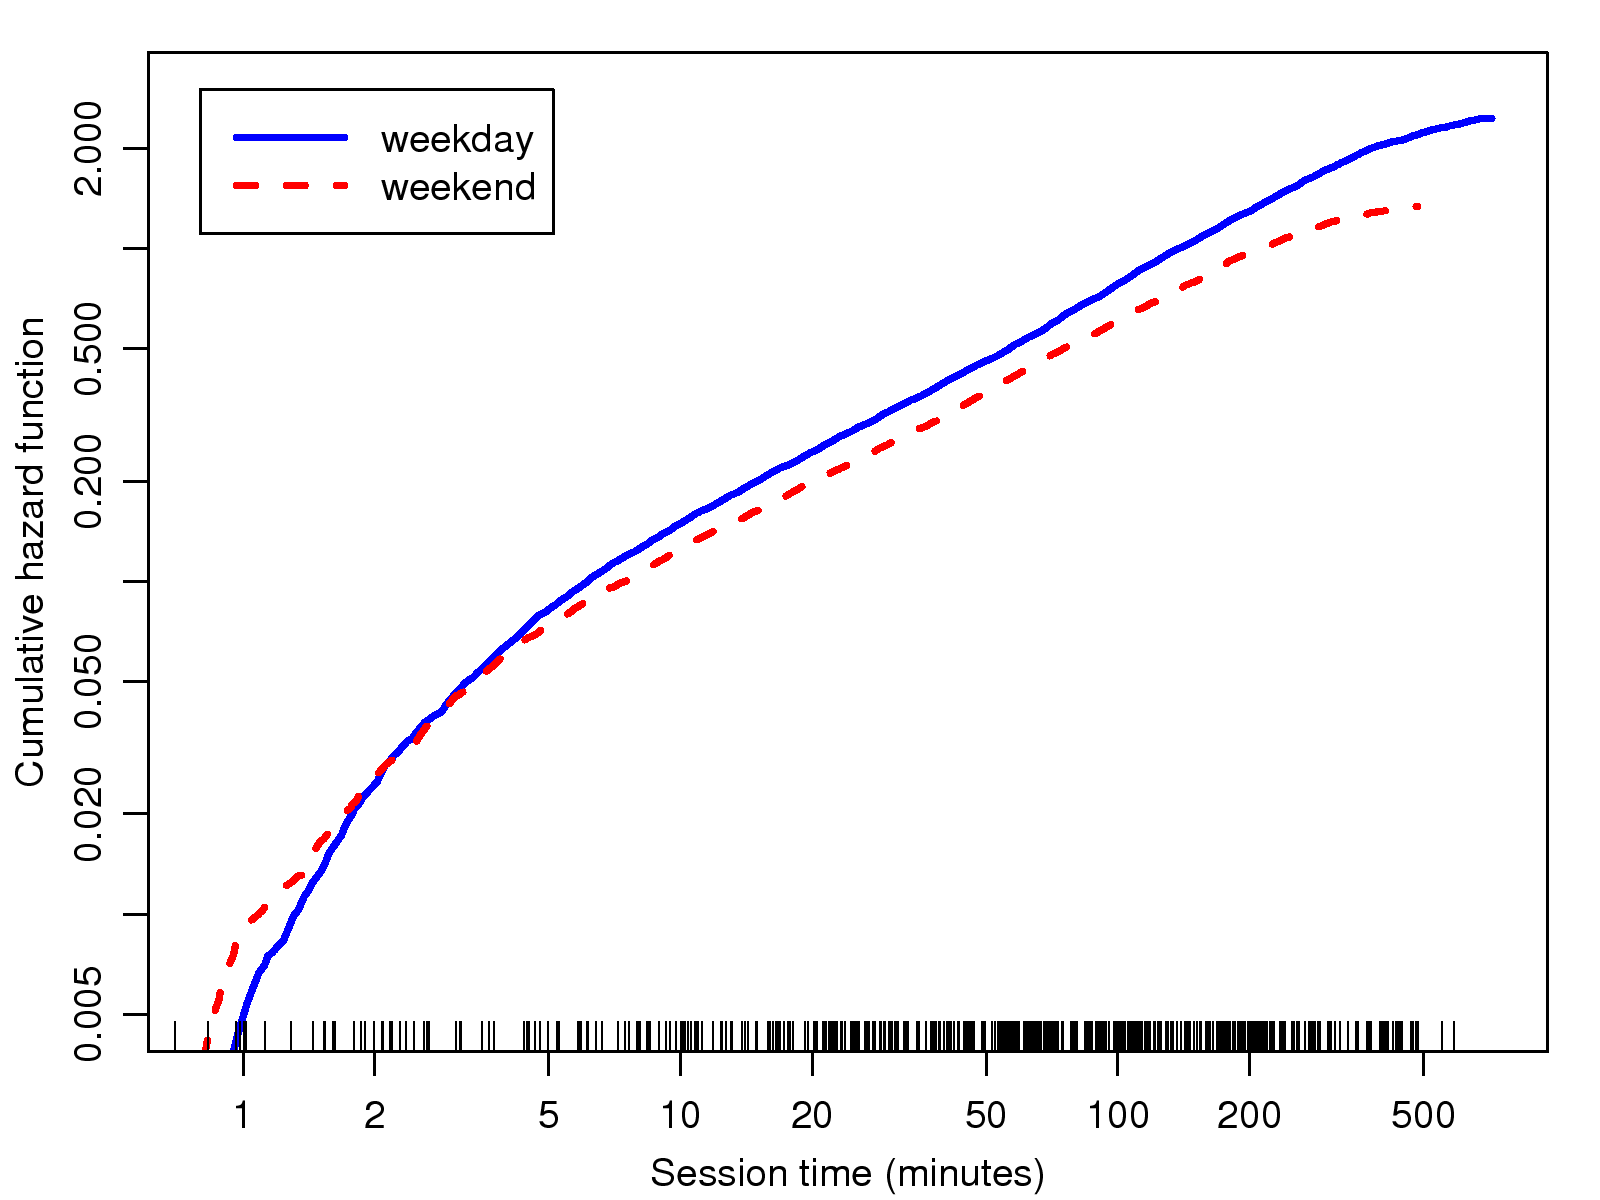
5.1 The Day of the Week Effect
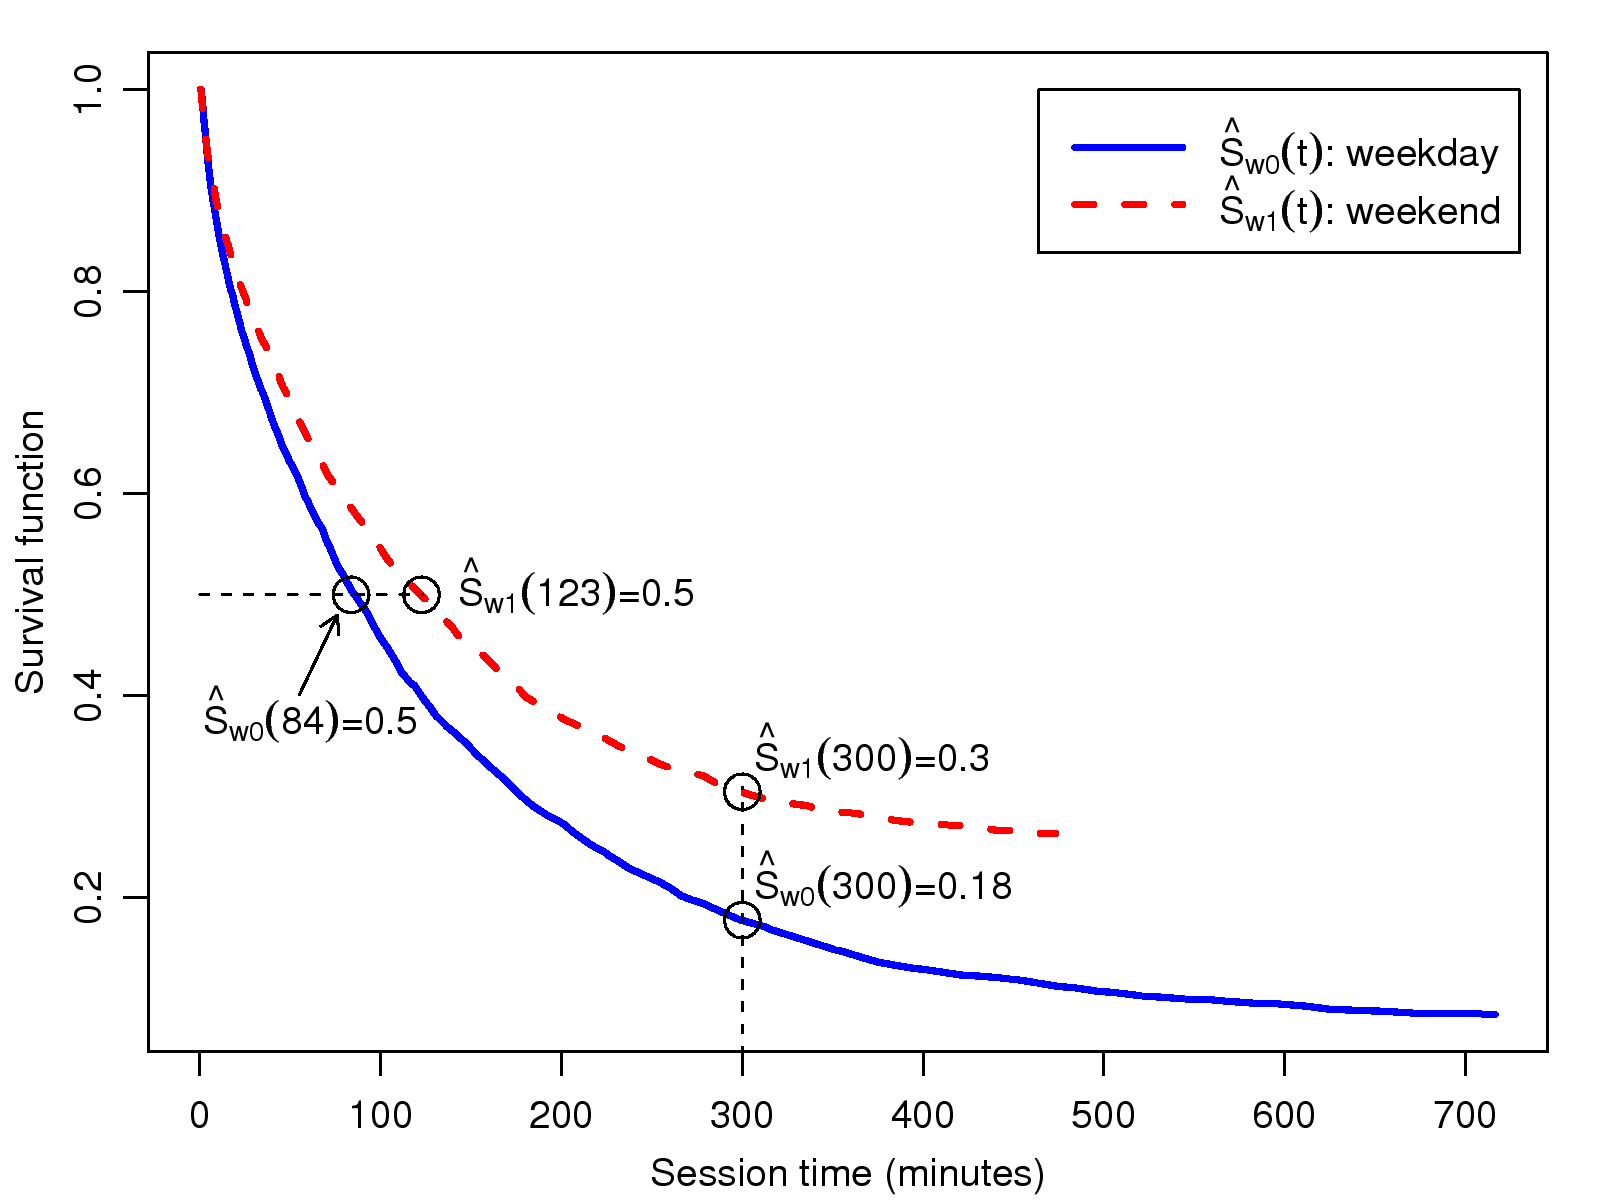
Figure 4: Survival curves for sessions on weekday and
weekend respectively
Having two traces, captured on a weekend day and a weekday
respectively, an intuitive question we want to answer is: Do
game playing times on these two days differ significantly? We use
the estimated survival functions for sessions on both days to answer
the question. As depicted in Fig. 4, the
median lifetimes are 123 minutes and 84 minutes for the weekend
and weekday, respectively. We can highlight this difference in
another way: while 30% of users play for more than 5 hours on a
weekend, only 18% of users stay for the same time on a weekday.
We use the the Mantel-Haenszel test (also known as the log-rank
test) [10] to judge whether a set of survival
functions is statistically equivalent. The log-rank test, with the
null hypothesis that both survival functions are equivalent, reports
p=1−Prχ2,1(245) ≈ 0, which strongly suggests the
existence of a day of the week effect.
5.2 Correlation with Network QoS
MMORPGs are different in that there are no explicit victories or
defeats, scores, or rankings, and the playing time is a more
appropriate indicator of the player's gaming experience. Therefore,
we expect players' staying times in MMORPGs will be affected, to
some extent, by the network QoS. Instead of asking how network QoS
affects game playing times, we begin with a more fundamental
question: "Do lifetime patterns differ significantly under
different network conditions?" To answer this, we plotted the
survival curves for sessions grouped by the minimum RTT experienced
by each session, and then checked the significance of the
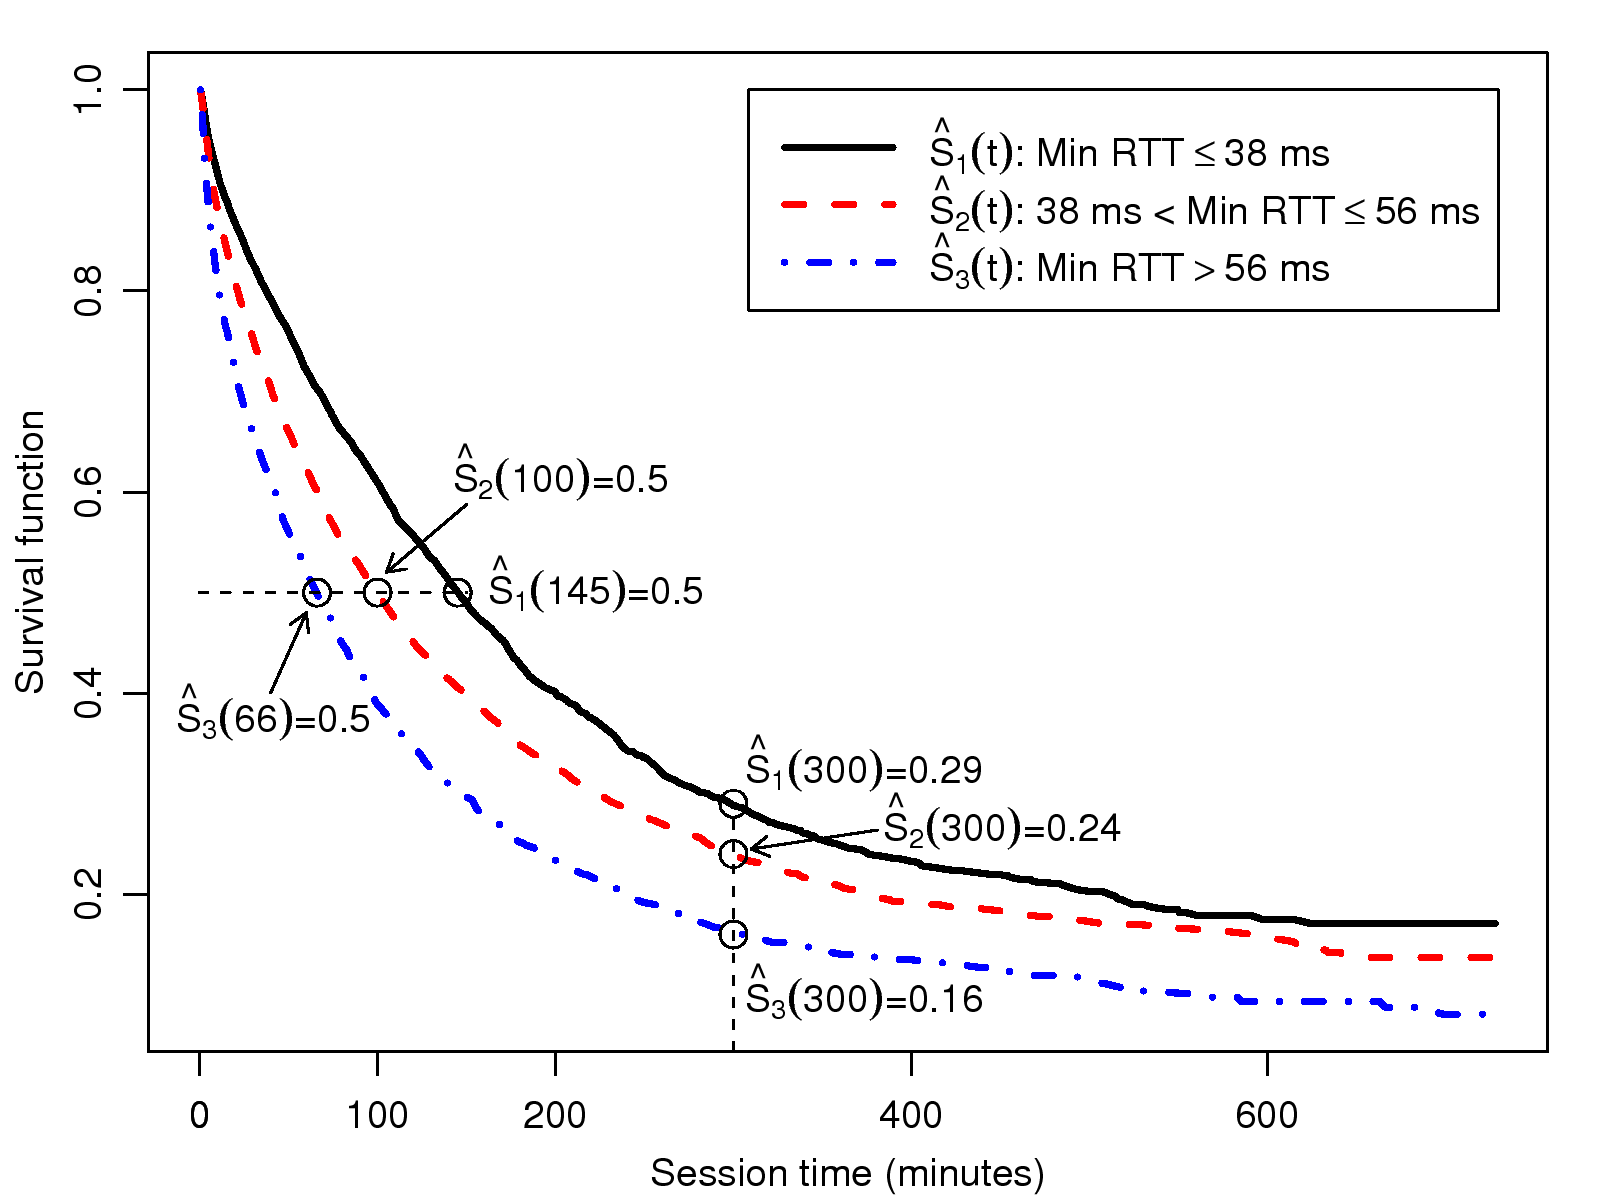
differences between the groups. In Fig. 5,
the survival curves of three session groups, divided by 25% (38
ms) and 75% (56 ms) percentiles, are plotted. Visually these
three curves diverge significantly from each other, and the log-rank
test reports p=1−Prχ2,2(342) ≈ 0, which indicates the
sessions in these groups were far from equivalent. The median
session times of groups 1 and 3 were 145 minutes and 66 minutes,
respectively, which gives a high ratio of 2.2. Therefore, we
confirm a pronounced correlation between game session times and the
minimum RTT the sessions experienced.
Figure 5: Survival curves for sessions with different
levels of minimum RTT
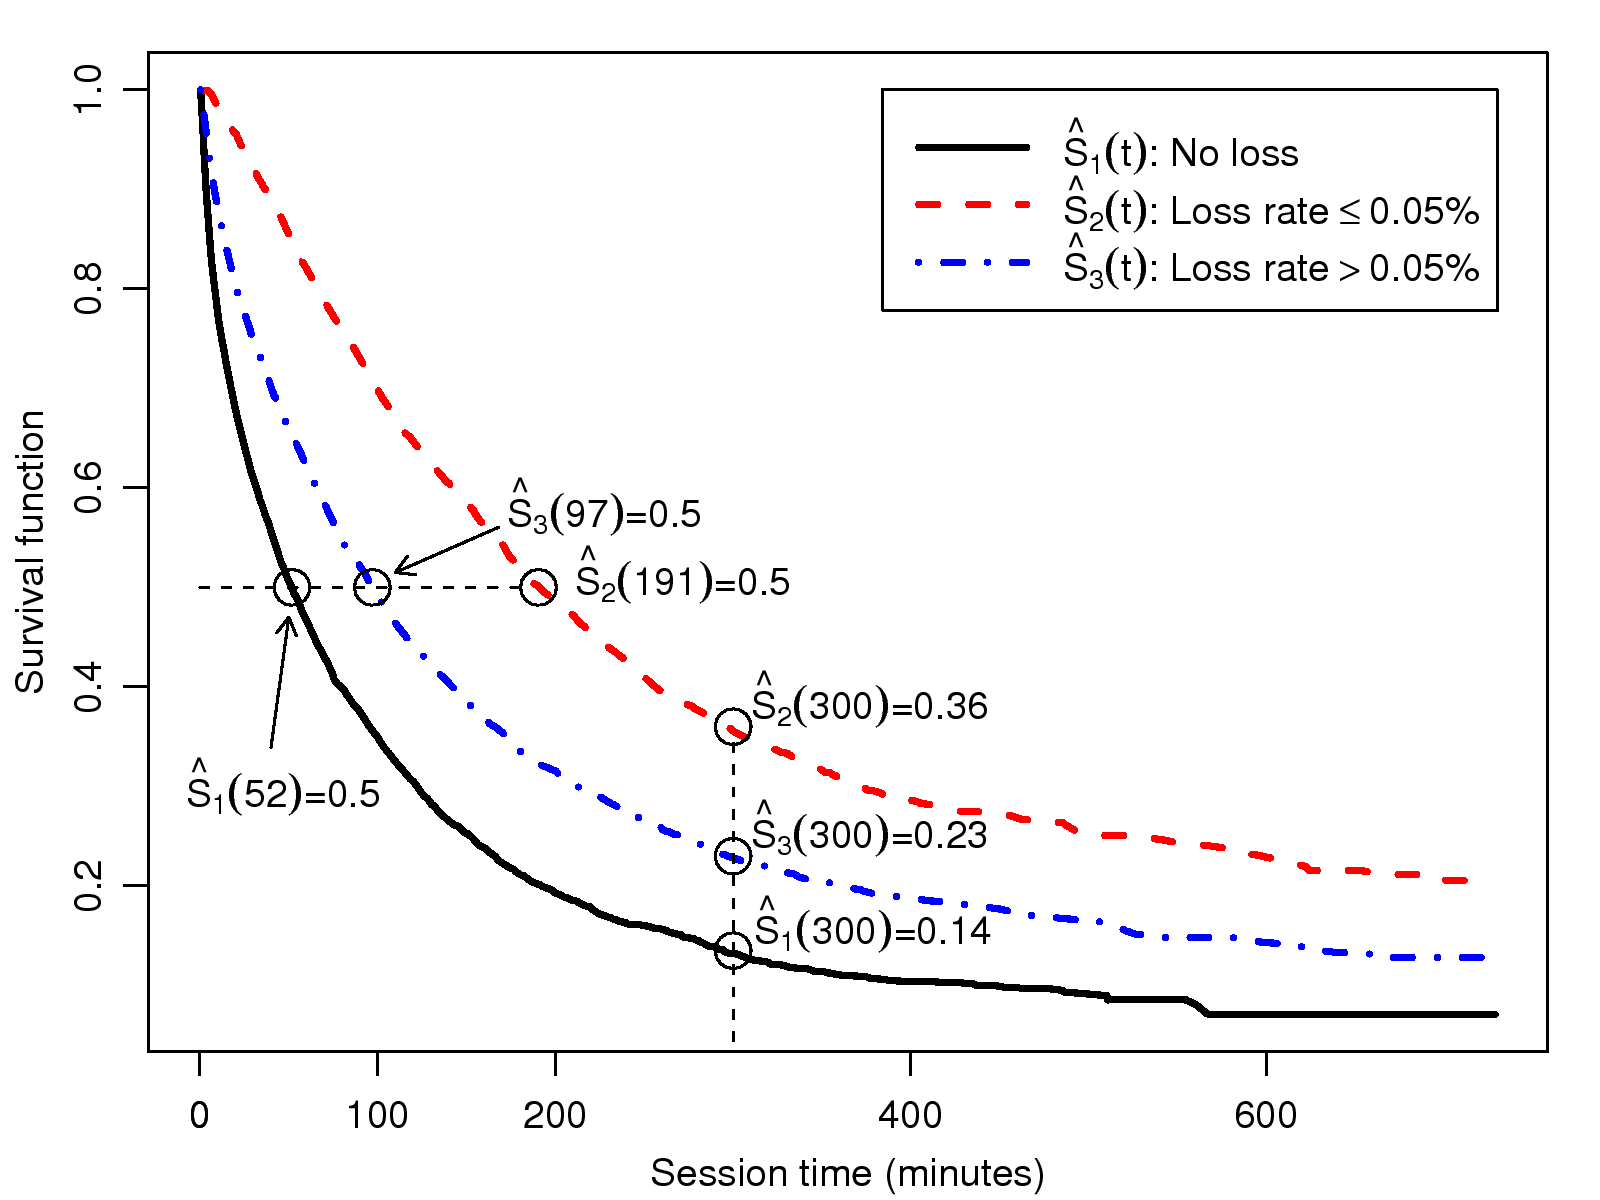
In addition to network latency, network loss is also considered an
important QoS factor related to gaming experience. Thus, we also
assess the relevance of network loss to session times by contrasting
the survival curves of sessions that experience different levels of
network loss, as shown in Fig. 6. The sessions
are classified into three groups by zero loss rate and 0.5%
( ≈ 90 percentile). Intuitively we expect that higher loss
rates lead to shorter game sessions; however, group 1, which incurs
no packet loss, has a much shorter average duration (52 minutes)
than groups 2 and 3 (191 and 97 minutes respectively). This can
be explained by the fact that short sessions are more likely to be
lucky enough not to incur any packet loss. If we focus on those
sessions with at least one packet loss, the median session time in
group 3 is almost half that in group 2. Also, the log-rank test
reports p=1−Prχ2,2(1277) ≈ 0, which suggests a
significant connection between packet loss rates and session times.
Figure 6: Survival curves for sessions with different
levels of loss rate
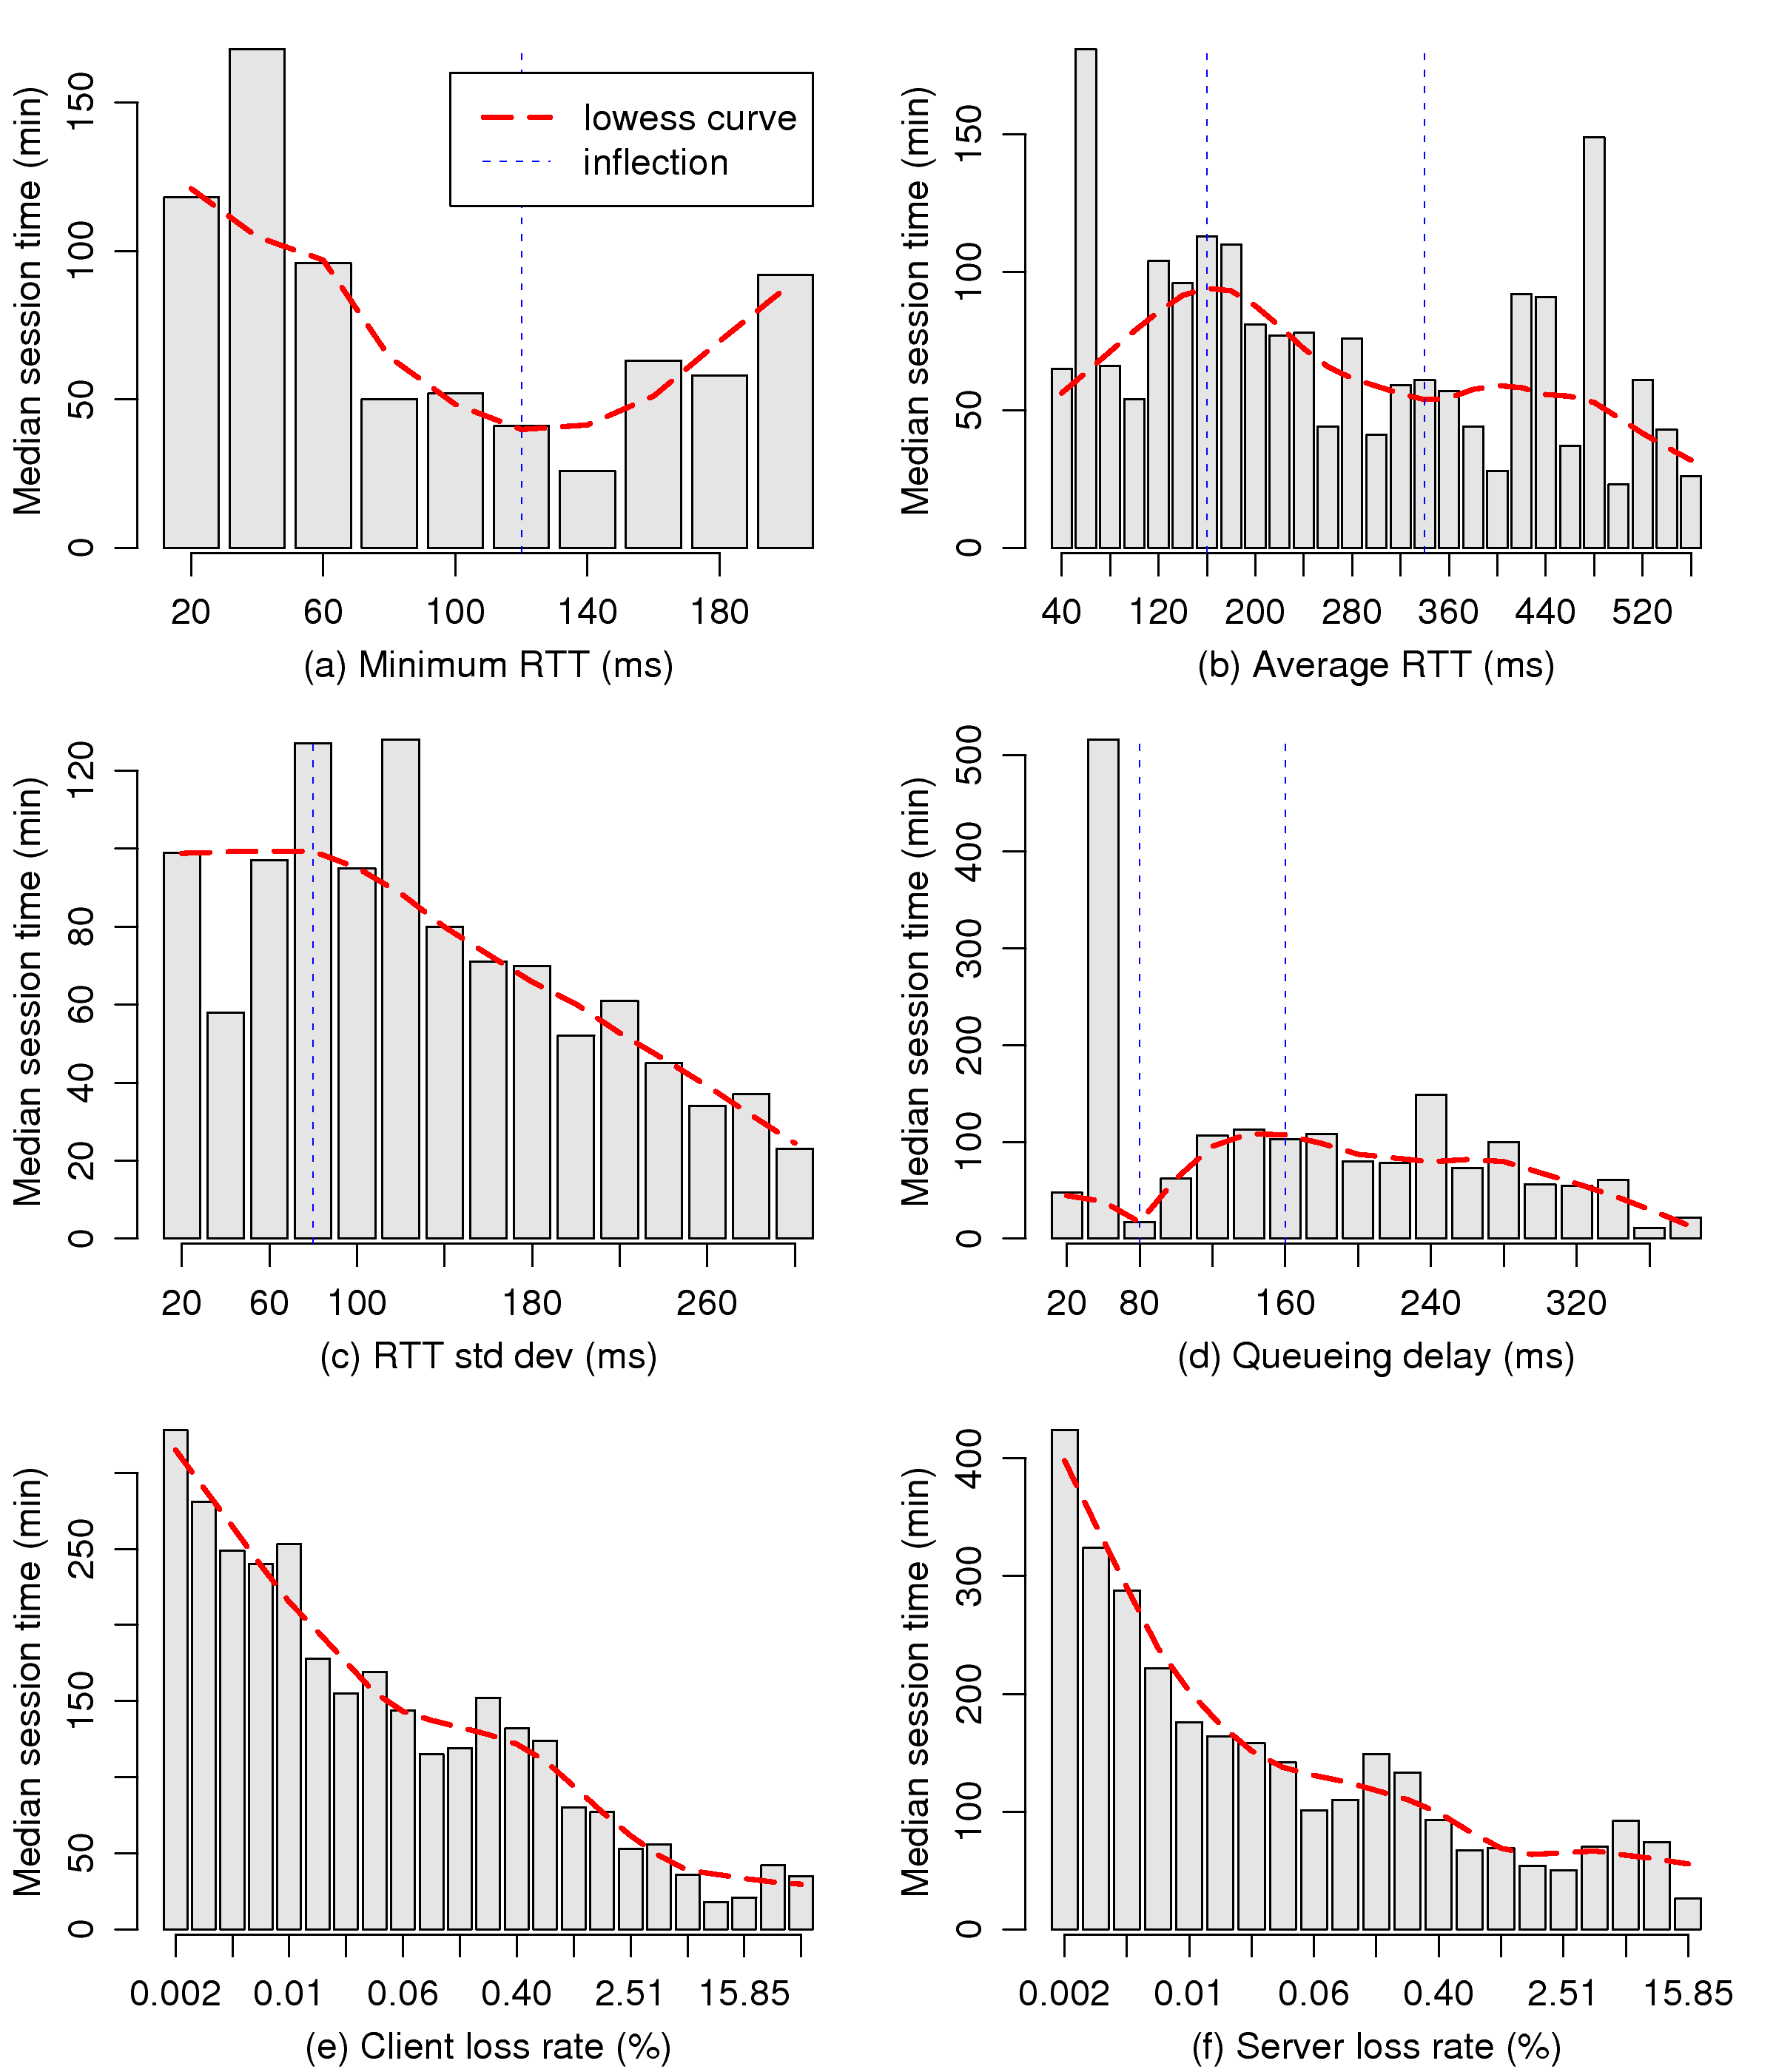
As the relevance of network QoS has been established, we can now
check the correlation between gaming times and various QoS factors,
namely, minimum RTT, average RTT, standard deviation of RTT (RTT std
dev for short), mean queueing delay, client packet loss rates, and
server packet loss rates. For brevity, hereafter, we use "client
loss rate" for the estimated loss rate of client packets; "server
loss rate" is similarly used. In Fig. 7, the median
times for session groups with different levels of network quality as
well as smoothed lowess curves [6] are plotted. For
network delay factors, we first detect a "threshold" effect, that
is, a negative correlation between playing times and network delay
is only apparent within certain range. For example, the negative
correlation of session times with minimum RTT exists only when the
minimum RTT is smaller than 120 ms (cf. Fig. 7(a)).
Despite the threshold effect, all network delay factors show a
negative correlation with game times within certain ranges. On the
other hand, the network loss shows a more consistent negative
correlation with gaming times without the threshold effect, while
the slope of the downward trend gradually becomes flatter for higher
loss rates.
However, we note that simple correlational analysis does not reveal
the true impact of individual QoS factors, because they are
highly collinear. For example, the correlation coefficient
between average RTT and minimum RTT and that between average RTT and
RTT std dev are both higher than 0.6. Given that all the three
RTT-related factors have significant correlations with session
times, which one is the "true source" of user dissatisfaction is
unclear. Players could be particularly unhappy because of one of the
factors, or be sensitive to all of them. Thus, to determine the
impact of individual factors, we adopt regression analysis, which
models game playing times as responses to various QoS factors, in
the next section.
Figure 7: Correlation of session times with network QoS factors
6 Proportional Hazards Regression
In this section, using the Cox proportional hazards model,
a semi-parametric regression method, we assess how each
individual QoS factor influences players' willingness to
continue with a game or leave it. In the following, we briefly
introduce the Cox regression model. Before the model can be
fitted, we check the validity of the assumptions and carry out
necessary adjustments. Then after developing the model, we assess
its adequacy by checking the outliers and performing
goodness-of-fit tests. Finally we validate the model by
prediction, and conclude this section with a discussion on the
modeling results.
In the correlational analysis (Section V-B), we
showed that sessions with and without packet loss exhibit
different lifetime patterns. To make the regression model
parsimonious, and since sessions that incur no packet loss are of
no interest to us as they contain no information about the
relationship between session times and network loss, we exclude
those sessions from our modeling. As a result, 6,680 out of
15,140 sessions remain.
6.1 The Cox Regression Model
The Cox proportional hazards model [7] has long been the
most used procedure for modeling the relationship between covariates
and censored outcomes. In the Cox model, we treat potential
network QoS factors, e.g., the average RTT, as risk factors
or covariates; in other words, as variables that could cause
failures. In this model, the hazard function of each session is
decided completely by a baseline hazard function and
the risk factors related to that session. We define the risk factors
of a session as a risk vector Z. Cox's basic model is
defined as:
h(t|Z) = h0 (t)exp(βtZ)=h0(t)exp(
p ∑ k = 1
βk Zk ),
(2)
where h(t|Z) is the hazard rate at time t for a session
with risk vector Z; h0(t) is the baseline hazard
function, which is computed during the regression process; and
β=(β1,…,βp)t is the coefficient
vector that corresponds to the influence of each risk factor.
Dividing both sides of Equation 2 by h0(t) and
taking the logarithm, we obtain
log
h(t|Z)
h0 (t)
= β1 Z1 + …+ βk Zk =
p ∑ k = 1
βk Zk = β tZ,
(3)
where Zp is the pth factor of the session. The right side of
Equation 3 is a linear function of covariates
and their respective coefficients, i.e., it is transformed to a
linear regression problem. The Cox model possesses the property
that, if we look at two sessions with risk vectors Z and
Z′, the hazard ratio (ratio of their hazard rates) is
h(t|Z)
h(t|Z′)
=
h0 (t)exp[∑k = 1p βk Zk ]
h0 (t)exp[∑k = 1p βk Z′k ]
=
exp[
p ∑ k = 1
βk (Zk − Z′k )],
(4)
which is a time-independent constant, i.e., the hazard ratio of the
two sessions is independent of time. For this reason the Cox model
is often called the proportional hazards model. On the other
hand, this imposes the most strict restriction when applying the Cox
model, because the validity of the model relies on the assumption
that the hazard rates for any two sessions must be in
proportion all the time.
Figure 8: Graphical check for proportionality of the
weekend factor
6.2 Proportional Hazards Check for Categorical Variables
We begin the model development by checking whether the proportional
hazards assumption is met for our data set. We first check the
assumption for the categorical variables in this subsection and for
the continuous factors in the next subsection.
For modeling purposes, we set a dichotomous variable, weekend,
indicating if a session was observed on the weekend. A graphical
check for the proportional hazards assumption is first performed by
grouping sessions by the categorical variable, and plotting the
cumulative hazard function Hi(t) versus t for each group i in
a log-log scale. If the proportional hazards assumption is met, the
log survival curves should steadily drift apart. Specifically, for a
dichotomous variable, the assumption requires that the hazard ratio
between "true" and "false" sessions is a constant. As
Fig. 8 shows, the two curves intersect at
t = 2 minutes and gradually deviate from each other thereafter,
which indicates that weekend violates the proportionality
assumption.
Now that a non-proportional categorical variable is present, to
accommodate the variable, we use the stratified Cox model.
The model augments the basic Cox model by incorporating the support
of strata, where each stratum has its own baseline hazard function.
For a Cox model with m strata (m = 2 in our modeling),
Equation 3 is generalized to
hi(t|Z) = h0i (t)exp(βtZ), i=1,…,m.
Note that, although the baseline hazard function for each stratum
can be different, the coefficient vector β is shared by all
strata.
Table 4: Time-dependent coefficients before
adjustment
Variable
tho
chisq
p
Variable
tho
chisq
p
rtt.min
-0.04
5.40
0.02
cl
-0.17
114.17
0.00
rtt.sd
0.03
3.03
0.08
sl
-0.34
5.61
0.02
Table 5: Time-dependent coefficients after
adjustment
Variable
tho
chisq
p
Variable
tho
chisq
p
rtt.min
0.01
0.38
0.54
cl
-0.03
1.85
0.17
rtt.sd
0.01
0.21
0.65
cl.med
-0.01
0.19
0.67
sl
-0.03
1.60
0.21
cl.hi
0.01
0.11
0.74
sl.hi
0.01
0.34
0.56
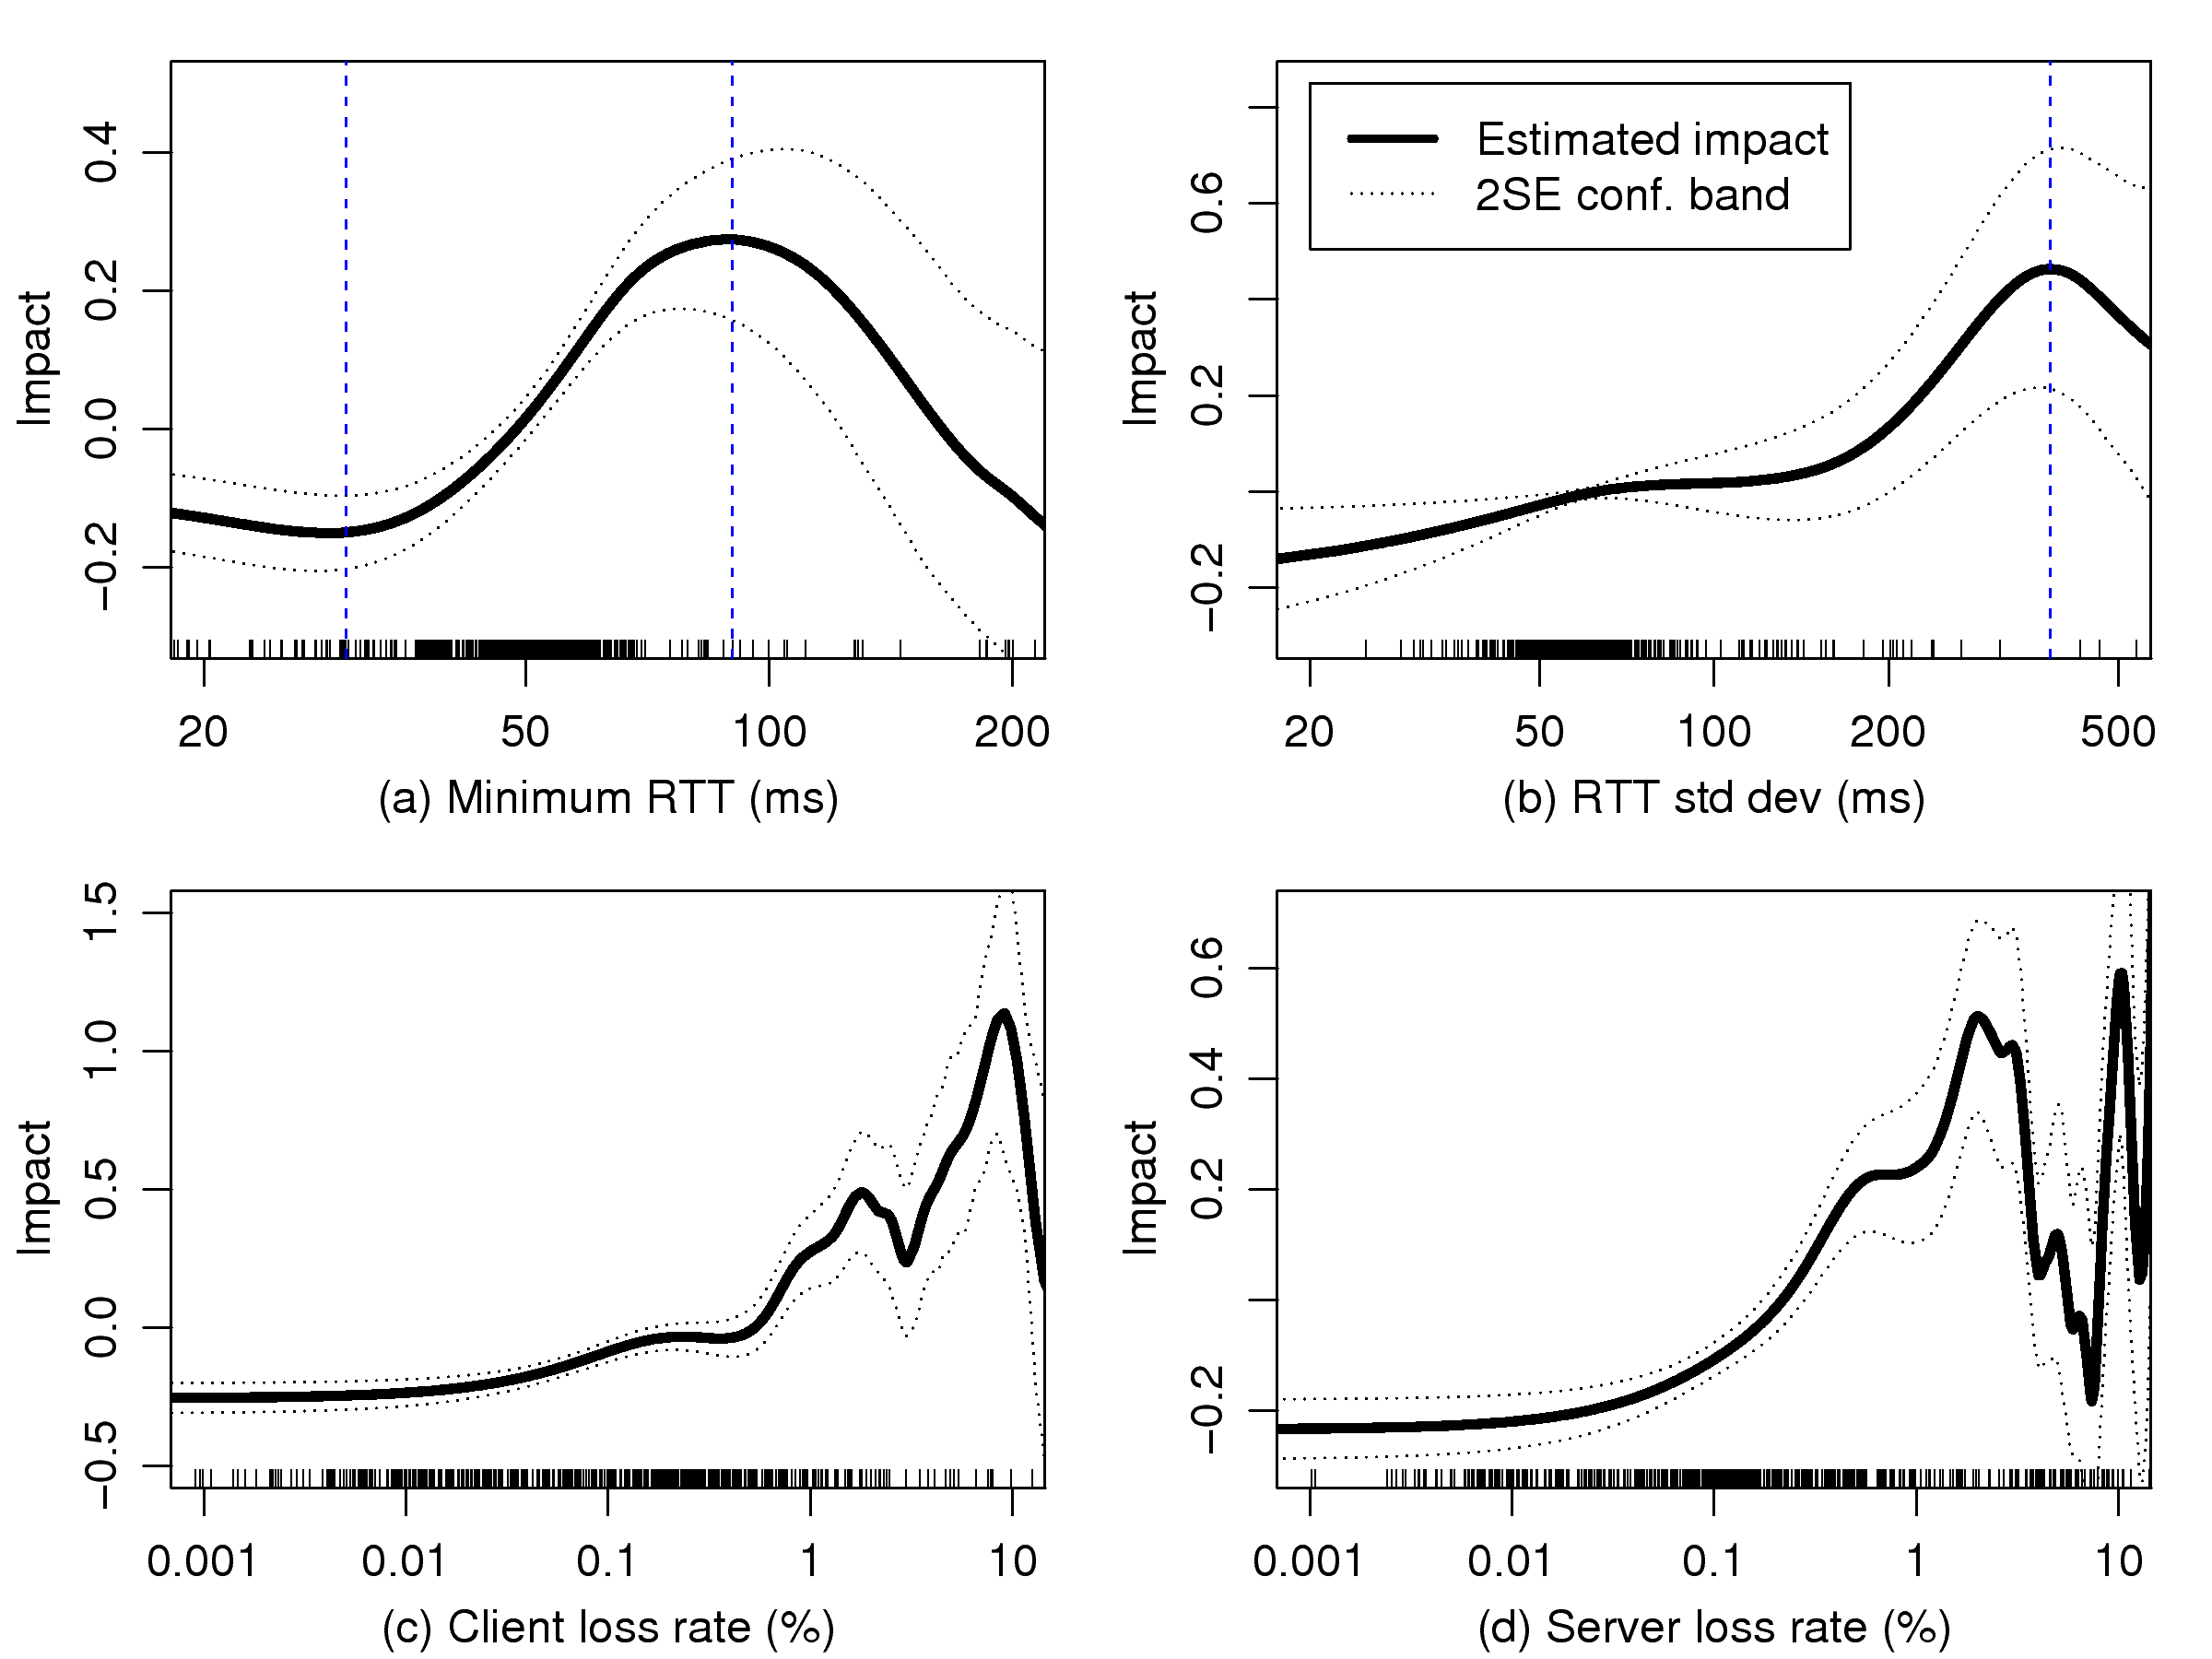
6.3 Functional Form Identification and Adjustment
Figure 9: The original (before adjustment) functional form
of the four factors
For a continuous variable, Cox's proportional hazards assumption
implies that a linear relationship between the covariates and the
hazard function, i.e., it implies that the ratio of risks between a
20 ms- and a 30 ms-average RTT session is the same as that between a
90 ms- and 100 ms-average RTT session. Thus, to proceed with the Cox
model, we must ensure our predictors have a linear influence on the
hazard functions.
We explore the correct functional form for the covariates by
E[si ] = exp(β t f(Z))
⌠ ⌡
∞
0
I(ti \geqslant s)h0 (s)ds
(5)
where f(z) is the "true" functional form for the covariate z.
This is just a Poisson regression model if h0(s) is known, while
the value of h0(s) can be approximated by fitting a Cox model
with unadjusted covariates. We can then fit the Poisson regression
model with smoothing spline terms for each
covariate [19]. The fitted terms for our QoS factors,
as well as their two-standard-error confidence bands, are plotted in
Fig. 9. Note that the average RTT and mean queueing
delay are not included in the model, since these two terms become
insignificant once the minimum RTT is incorporated into the model.
Also, the minimum RTT, which can be seen as an approximation of
round-trip propagation delay time, describes the observations much
better from a log-likelihood point of view. From the graph, we
observe that both the minimum RTT and RTT std dev have roughly
proportional influence in the dense region, i.e., the region where
observations are concentrated (note the "rugs" at the bottom of
each plot). The vertical dashed lines denote a possible cutoff line
that reflects the "threshold" effect we observed in
Section V-B. However, the influence of loss rates
is not proportional to their magnitude in any case; thus,
modeling their influence as linear would not be realistic or
accurate. A solution for non-proportional variables is the
scale transformation. We find that after taking logarithms,
the transformed variables, cl and sl, for client loss rates and
server loss rates respectively, have a smoother and approximately
proportional influence on the failure rate. That is, the failure
rate is proportional to the scale of the loss rate, rather
than their magnitude (Figs. 12 and
13).
Despite the threshold effect and the non-strict-linearity of our
covariates, we first test whether the proportional hazard assumption
holds. One test is to fit the same data to a more generalized Cox
model which allows time-dependent coefficients [19]. In
this model, Equation 3 is extended to
log
h(t|Z)
h0 (t)
=
p ∑ k = 1
β(t) k Zk =
p ∑ k = 1
(βk+θkln(t)) Zk,
where the coefficient vector β(t) is not constant, but
time-dependent. The null hypothesis, which indicates the conformance
of the proportional hazards assumption, corresponds to
θk ≡ 0,k=1,…,p. In this case, β(t) in the
extended model reduces to β in the standard model. The test
is similar to a standard linear trend test in that it tests whether
a significant non-zero slope exists by a ordinary least square
regression. The test results of our current model are listed in
Table IV. In the table, the column rho is the
Pearson product-moment correlation between the scaled Schoenfeld
residuals and ln(t); chisq gives the test statistics, which has
an asymptotic χ21 distribution. The significance values show
that, except for rtt.sd, other covariates reject the proportional
hazards assumption at significance level 0.05, and all are
rejected at level 0.1. Thus, we need some adjustments for these
covariates so that the proportionality assumption holds.
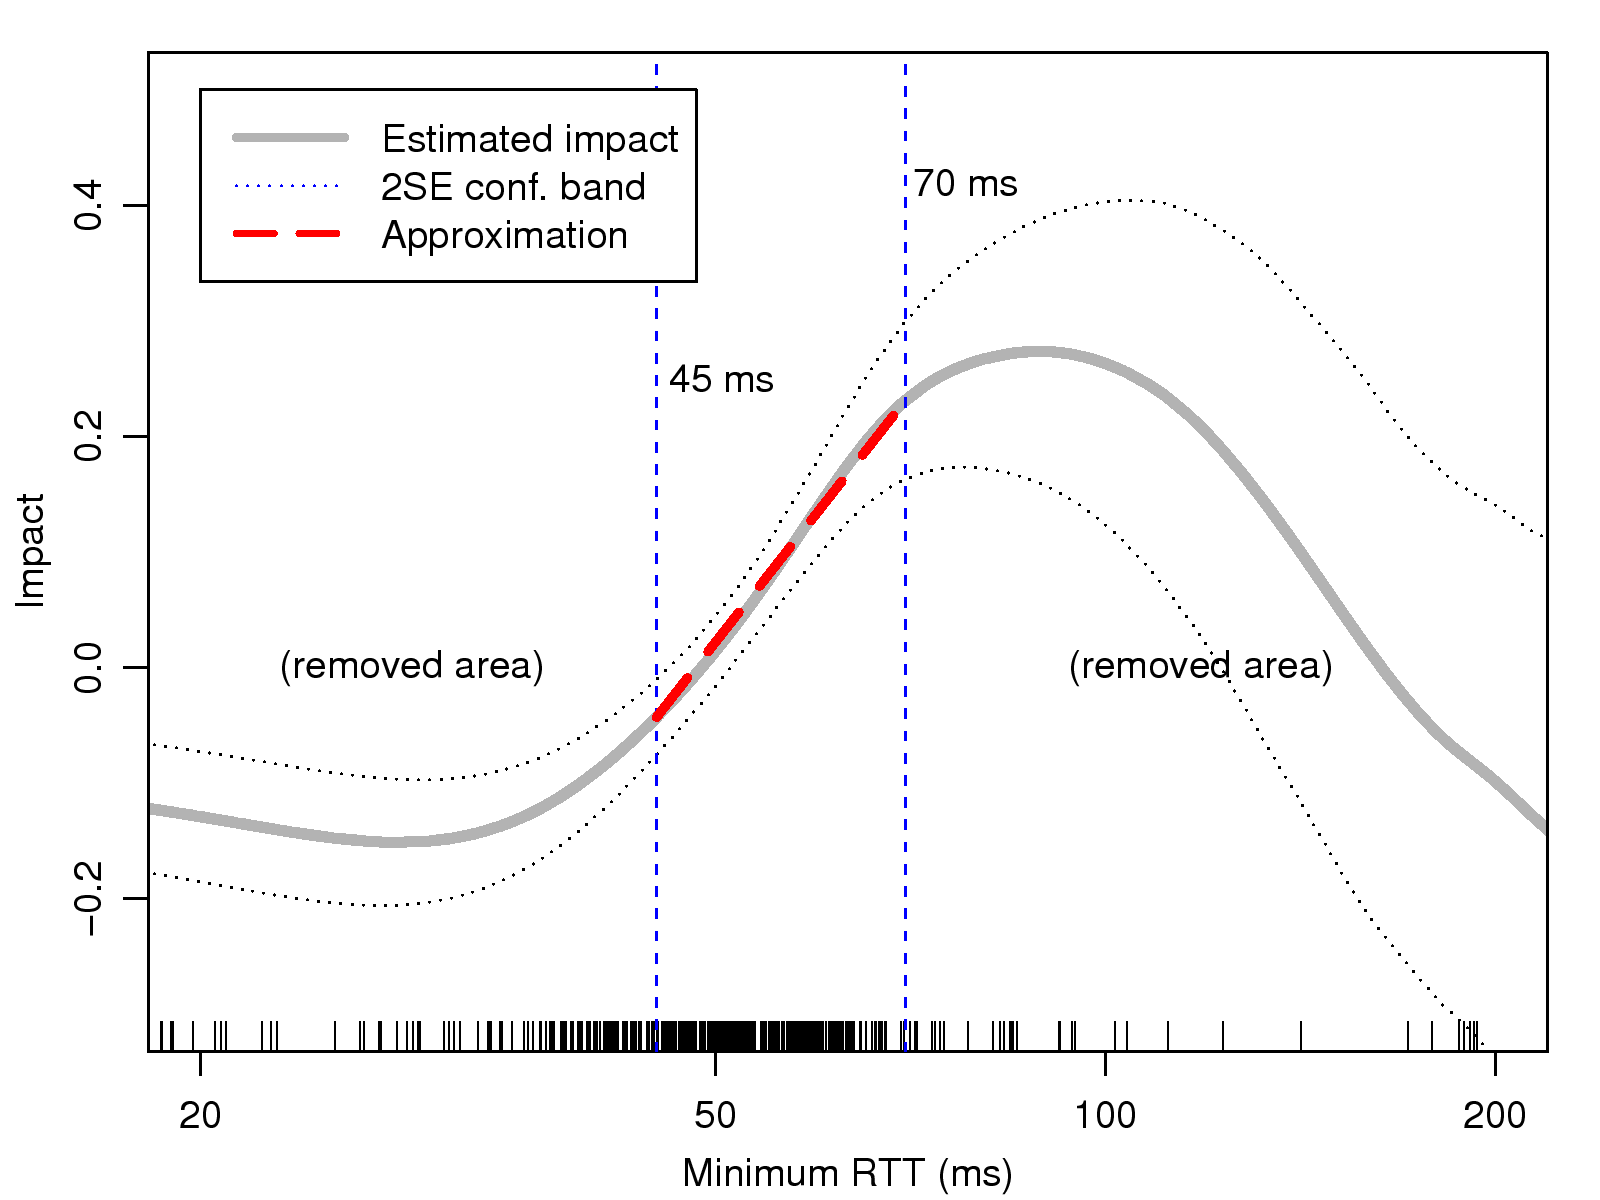
Figure 10: The functional form of the rtt.min
factor
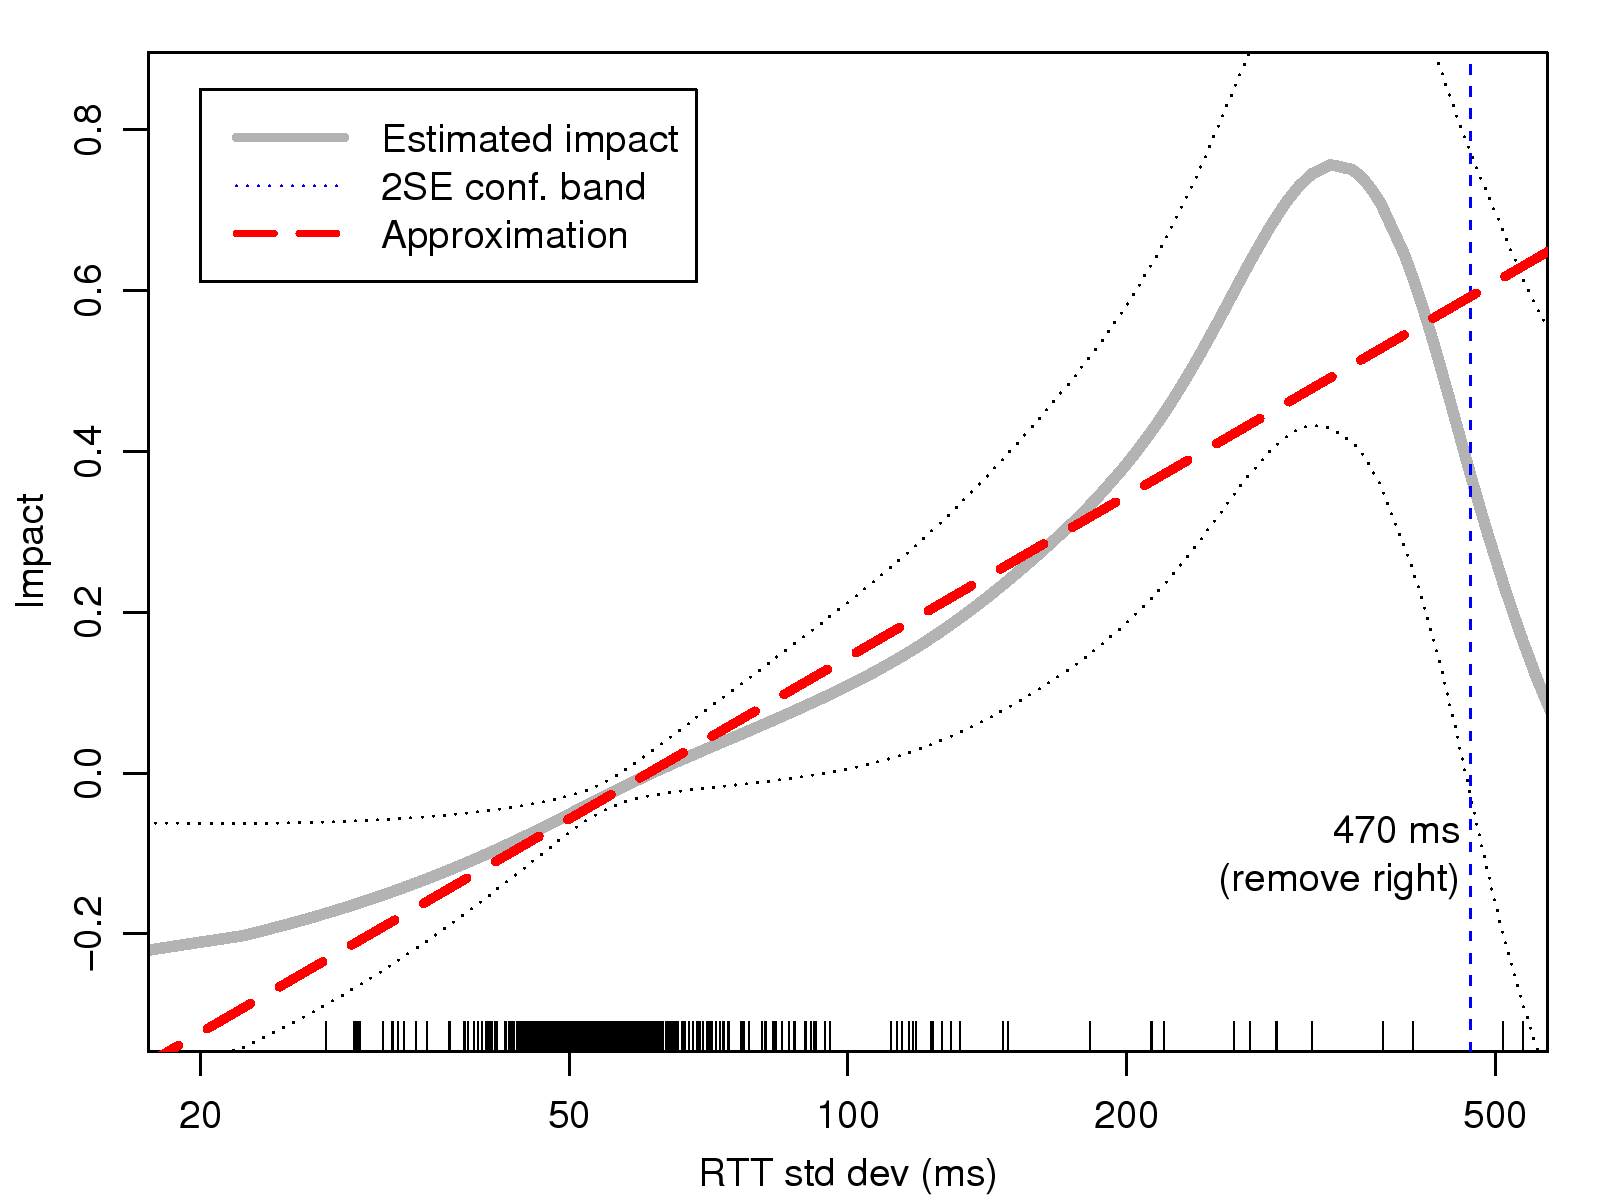
Figure 11: The functional form of the
rtt.sd factor
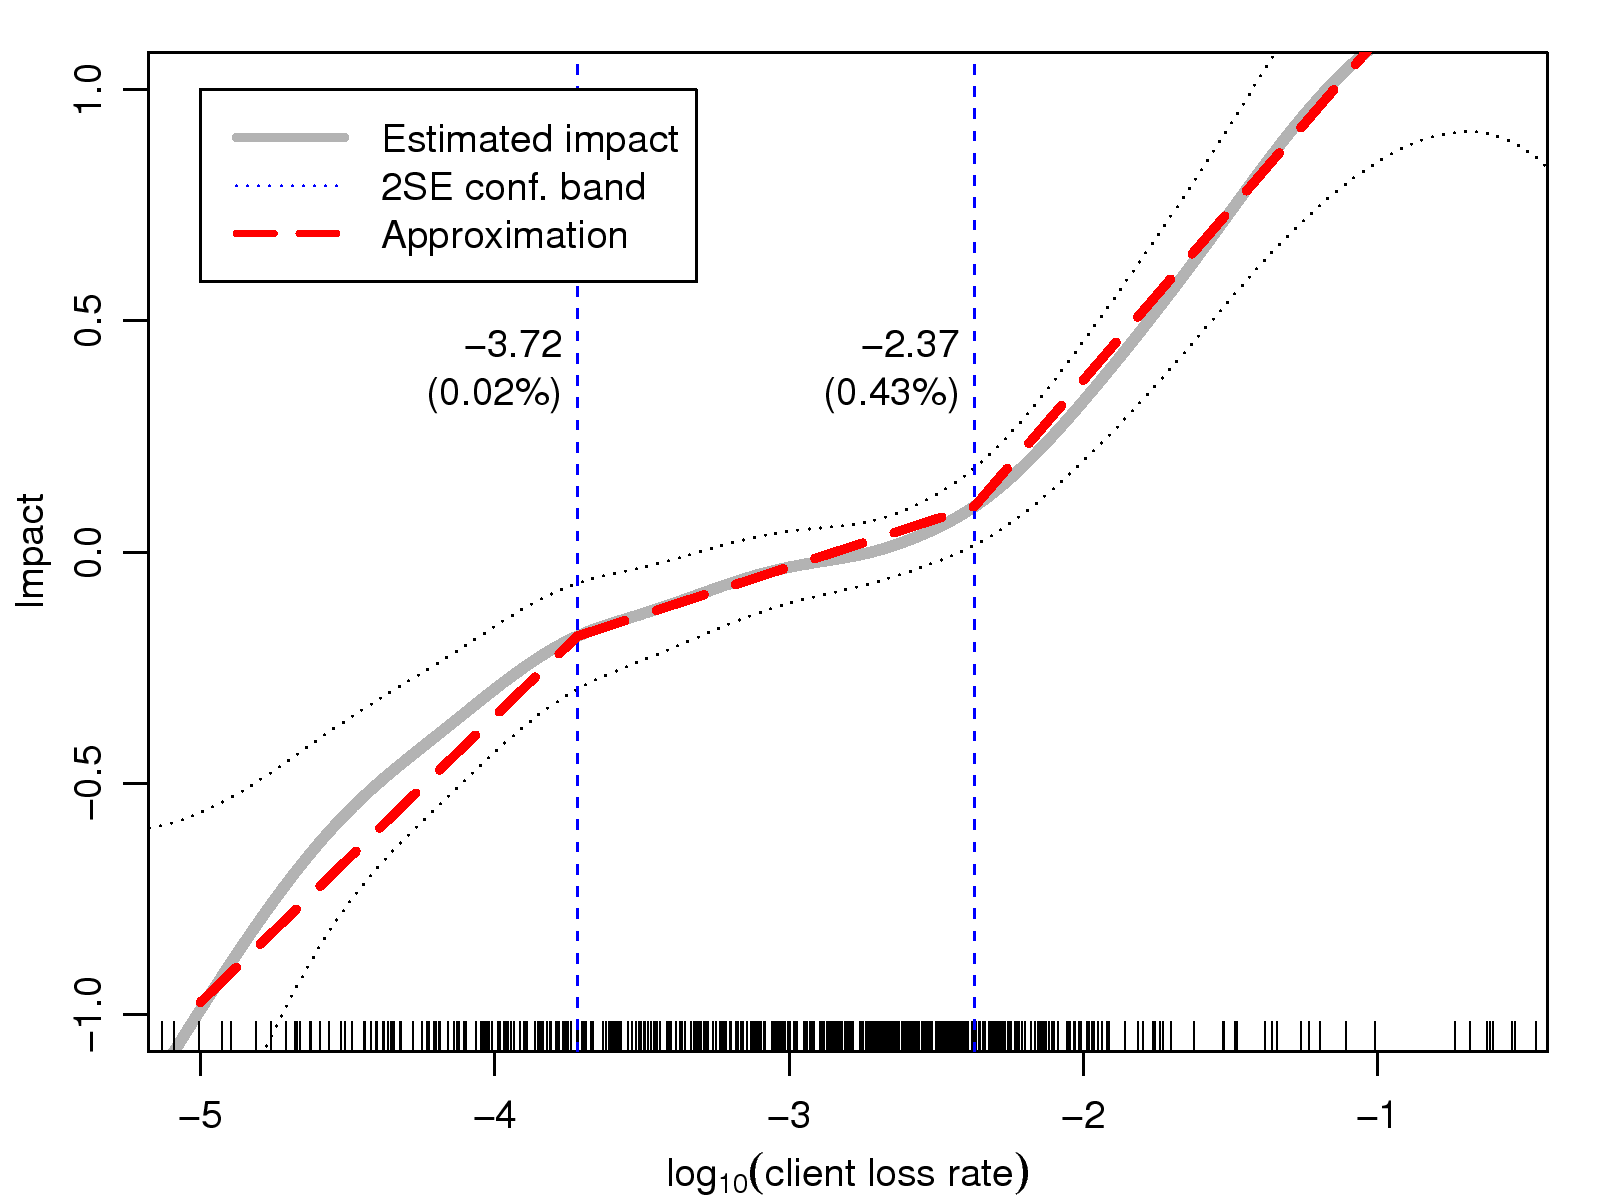
Figure 12: The functional form
of the cl factor with a linear-spline approximation
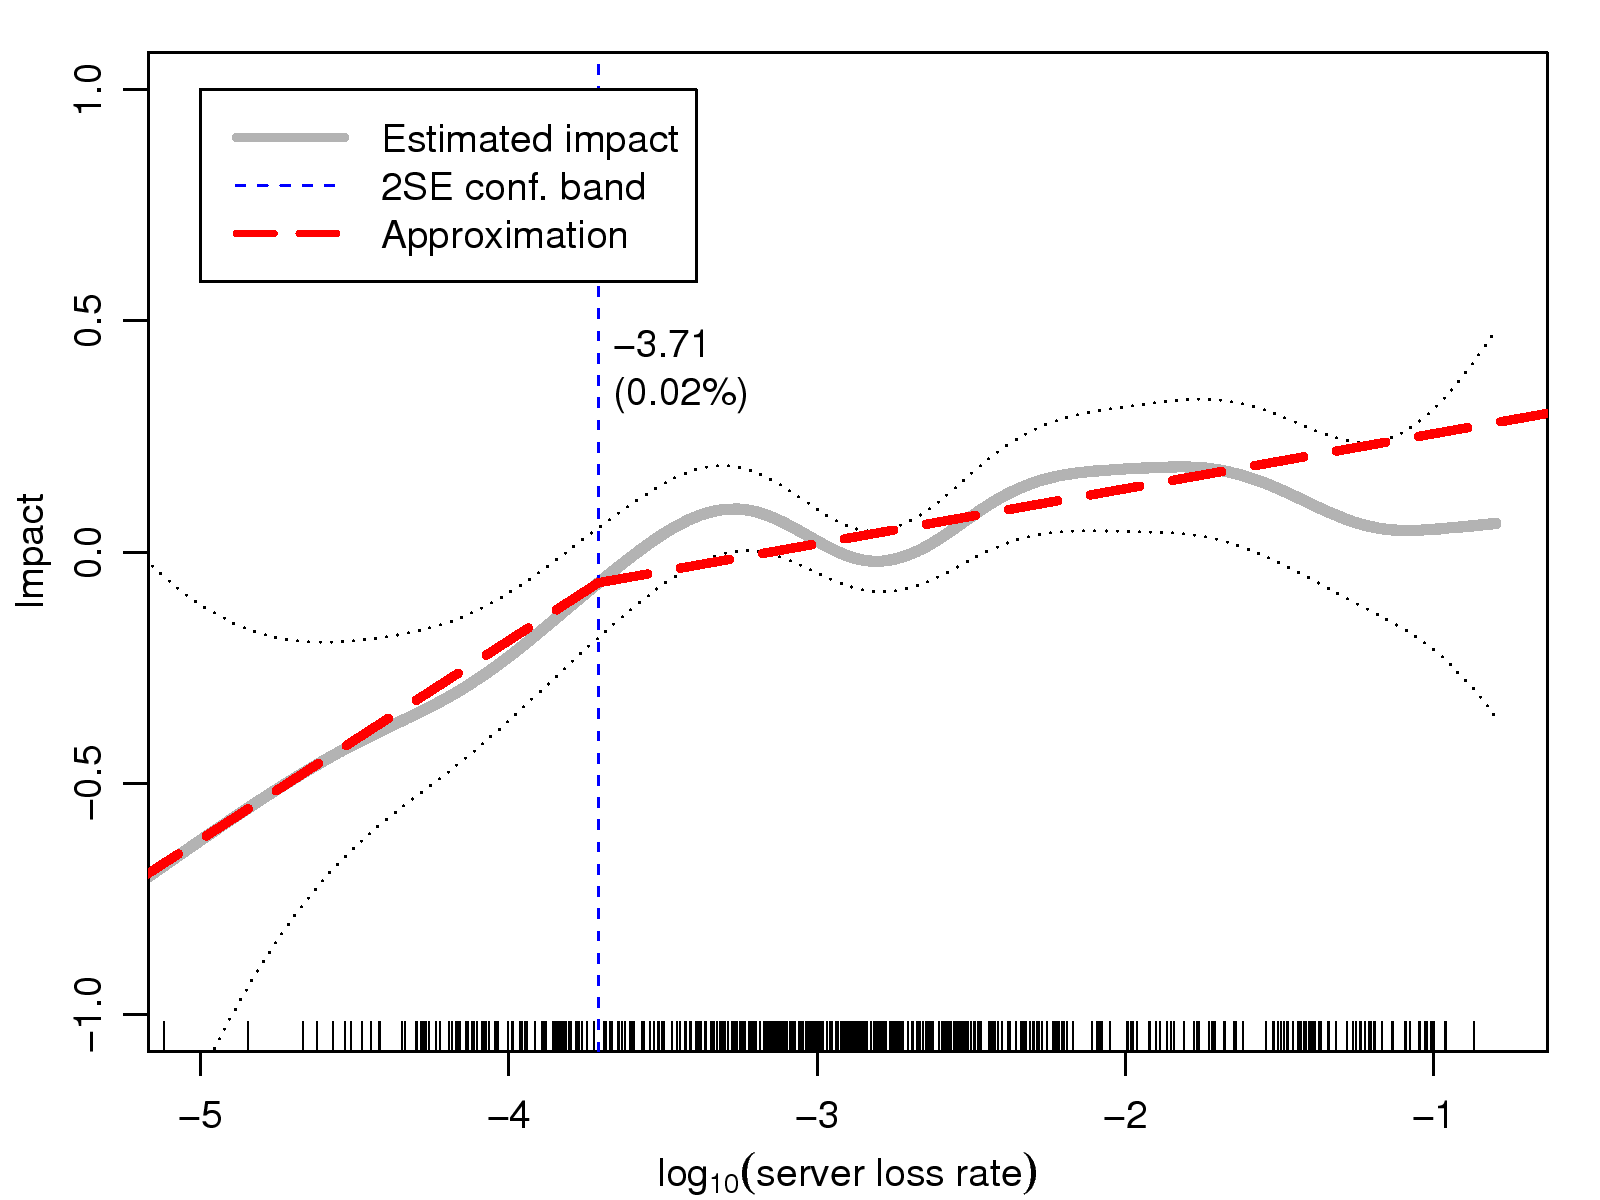
Figure 13: The functional form of the sl factor with a
linear-spline approximation
First we inspect the functional form of rtt.min shown in
Fig. 10. We consider the pronounced threshold
effect is plausible in that a minimum RTT smaller than a certain
threshold will not make a difference to the gaming experience, i.e.,
a 10 ms- and 20 ms-minimum-RTT should be indistinguishable by
players. On the other hand, for large minimum-RTTs, which are nearly
always experienced by sessions initiated in other countries, players
must be accustomed to struggling against large network latency which
is unavoidable. Therefore, to put rtt.min into the Cox model, we
need to cut out the non-proportional-influence sections. For this
purpose, we search for the best thresholds (cut-off points) by
minimizing the chisq statistic in the above proportional hazard
test. The resulting thresholds of 45 and 70 ms, shown in
Fig. 10, bracket the linearly influential section
of rtt.min. By similar arguments, rtt.sd also exhibits a
threshold effect, but it only applies to large RTT fluctuations,
i.e., RTT std dev causes players approximately proportional
discomfort as long as its magnitude is not too high. The computed
threshold is 470 ms. It can be shown that a linear approximation
to RTT std dev's true influence with rtt.sd ≤ 470 ms is
appropriate, as the line is consistently within the confidence band
(Fig. 11).
The covariates of the packet loss rates, cl and sl, shown in
Figs. 12 and 13 respectively, do not
exhibit the threshold effect, but their influence is clearly
non-linear. We choose to approximate their influence by linear
splines, that is, piecewise linear segments connected by "knots,"
while the locations of the knots are obtained using a minimum
partial log-likelihood approach. By incorporating new covariates,
cl.med and cl.hi, for cl, and sl.hi for sl, we model the
influence of cl and sl by three- and two-segment-linear splines,
respectively, so that the whole linear spline function is within the
corresponding confidence bands (see Fig. 12 and
Fig. 13). The new covariates are defined by
cl.med
=
⎧ ⎪ ⎨
⎪ ⎩
cl−(−3.72)
if cl ≥ −3.72,
0
otherwise;
cl.hi
=
⎧ ⎪ ⎨
⎪ ⎩
cl−(−2.37)
if cl ≥ −2.37,
0
otherwise;
sl.hi
=
⎧ ⎪ ⎨
⎪ ⎩
sl−(−3.71)
if sl ≥ −3.71,
0
otherwise,
where the knots of cl are −3.72 ( ≈ 0.02%) and −2.37 ( ≈ 0.43%) respectively, and the knot of sl is −3.71 ( ≈ 0.02%). The integrated influence of the client loss rate
and the server loss rate can then be computed by
cl×βcl+cl.med×βcl.med+cl.hi×βcl.hi
and sl×βsl+sl.hi×βsl.hi respectively.
Incorporating these new covariate reduces the log-likelihood by
25.7, which is significant for a chi-square distribution with
three degrees of freedom. After the covariates are adjusted for
proportionality assumption, we perform the proportional assumption
test again, and list the results in Table V.
According to the table, all covariates do not reject the linearity
hypothesis at significance level 0.1 after the adjustments, i.e.,
all covariates are approximately linear in terms of their influence
on game playing times.
Now that the proportional hazards assumption is affirmed, we adopt a
stepwise approach for the selection of significant interaction
terms. As no interaction terms are significant at 0.05, we keep the
model intact with the original seven covariates.
We defer the presentation and discussion of the fitted model to
later sections (Section VI-F and
VI-G), following a check for outliers and a
goodness-of-test for the model's adequacy.
6.4 Outlier Detection
To assess the impact of individual sessions in a regression model,
the most direct measure of influence is the jackknife value
Ji=[^(β)]−[^(β)](i), where
[^(β)](i) is the result of a fit that includes all
observations, except session i. Because the jackknife involves a
significant amount of computation, we use the dfbeta residuals to
approximate the jackknife value [19]. Note that
dfbeta residuals have the opposite implication of the jackknife,
i.e., they indicate the change of β with the inclusion
of a particular individual.
The potential outliers we identified are mostly sessions that
experience unfavorable network conditions, but have rather long
durations. We determine whether a session is "reasonable" by two
metrics: cli.prate, the average client data packet rate; and
srv.prate, the average server data packet rate. The former can be
seen as an indicator of player activities, such as movement and
attack, while the latter indicates the degree of interaction, since
server packets primarily contain status updates of the nearby
environment. We treat potential outliers whose cli.prate or
srv.prate is smaller than their 20% percentile as actual
outliers and remove them from the trace. The rationale behind this
is that low cli.prate and srv.prate indicate that the
participants did not actively play the game, or even left the game
idle for some period; therefore their corresponding session times
are less reliable.
As a result, 38 out of 3,027 sessions were removed according to
the above rules.
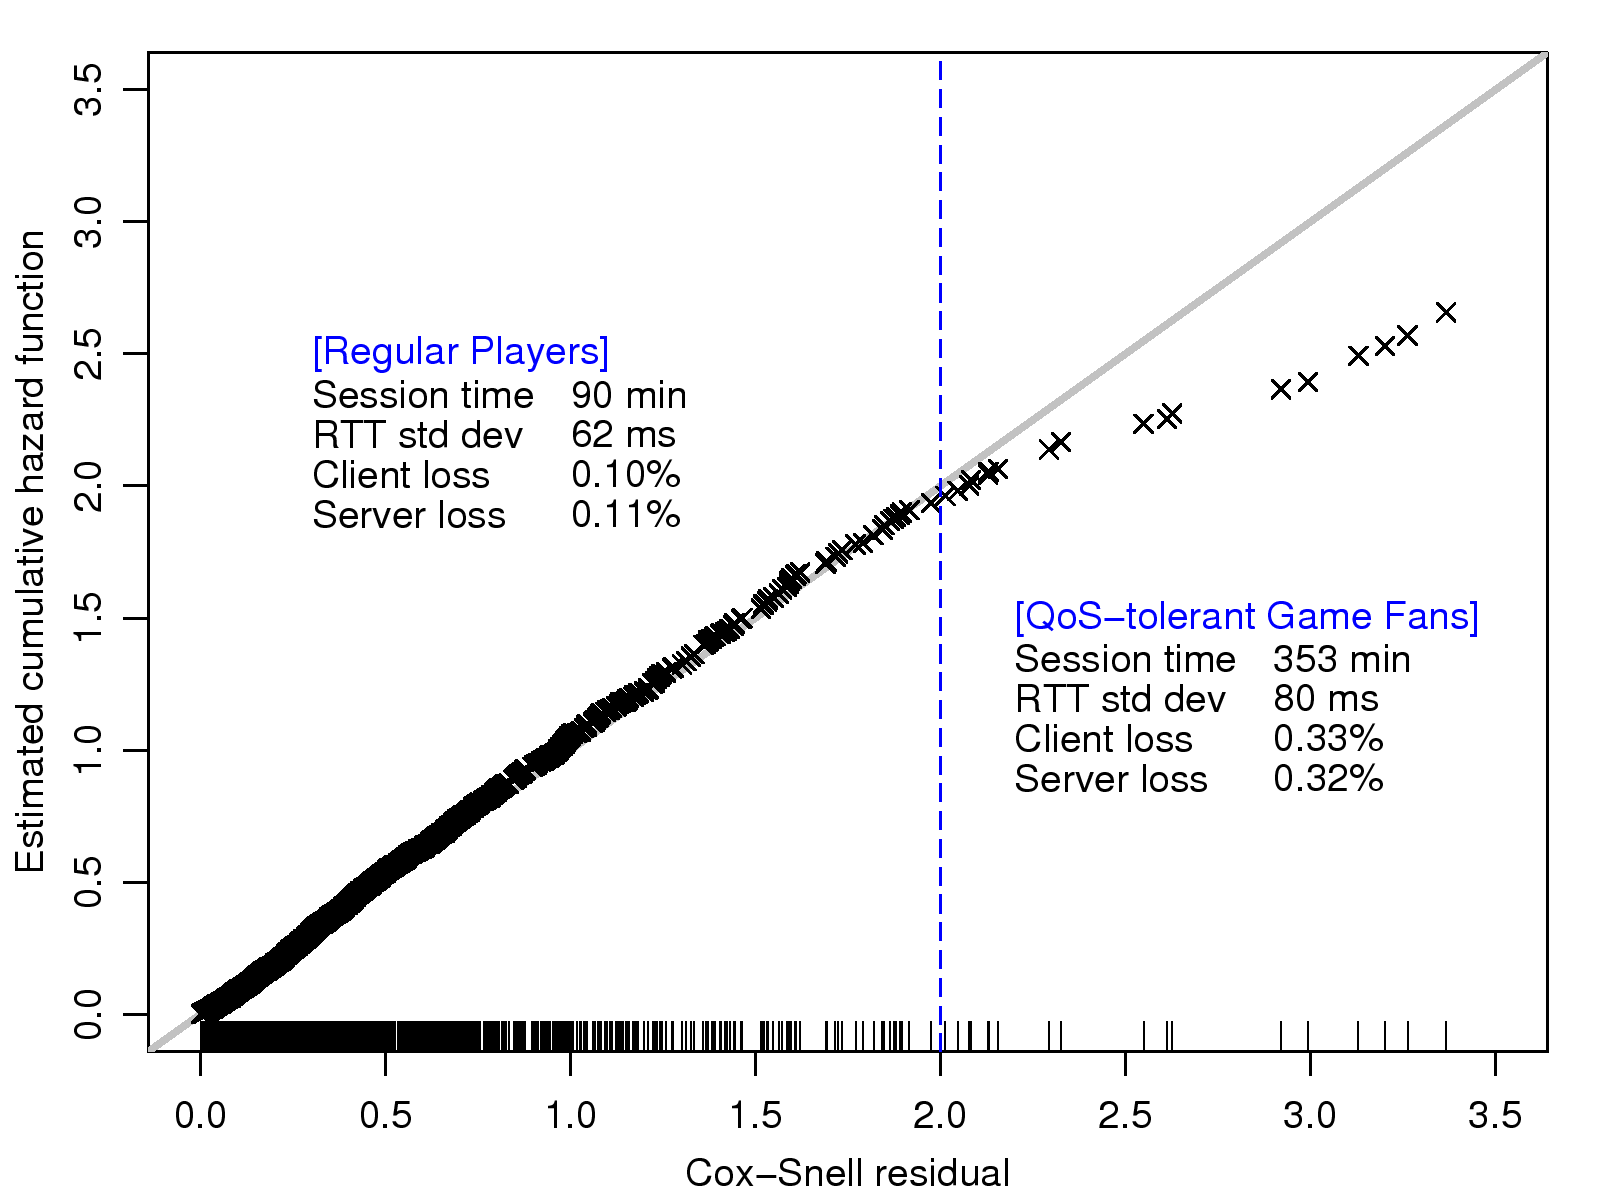
6.5 Assessment of Model Adequacy
We use the Cox and Snell residuals to assess the overall
goodness-of-fit of our model [8]. If the model is
correctly fitted, the random variable
ri=[^H](ti,Zi) has an exponential distribution with
a hazard rate of 1, where [^H](ti,Zi) is the
estimated cumulative hazard rate for session i with risk vector
Zi. Accordingly, the plot of ri and its Kaplan-Meier
estimate of survival function [^S](r) will be a straight line
through the origin with a slope of 1. The graphical check is
plotted in Fig. 14, in which most sessions are along a
45° straight line, especially in the dense area. A few
sessions ( ≈ 4%) deviate from the straight line. We believe
these sessions are due to QoS-tolerant game fans who experience
higher delay variations and loss rates, but still play the game
about four times longer than regular players. Except for the
divergence due to such game fans, most sessions fit the model very
well; therefore, the adequacy of the fitted model is confirmed.
Figure 14: Cox-Snell residuals plot for overall goodness of
test
Table 6: Coefficients in the Final Model
Variable
Coef
Exp(Coef)
Std. Err.
z
P > |z|
rtt.min
19.20
2.2e+08
3.90
4.93
8.29e-07
rtt.sd
4.54
94
0.52
8.70
0.00e+00
cl
0.70
2
0.15
4.85
1.23e-06
cl.med
-0.52
0.59
0.18
-2.87
4.07e-03
cl.hi
0.64
1.9
0.11
5.76
8.29e-09
sl
0.45
1.6
0.16
2.88
4.00e-03
sl.hi
-0.35
0.7
0.17
-2.03
4.25e-02
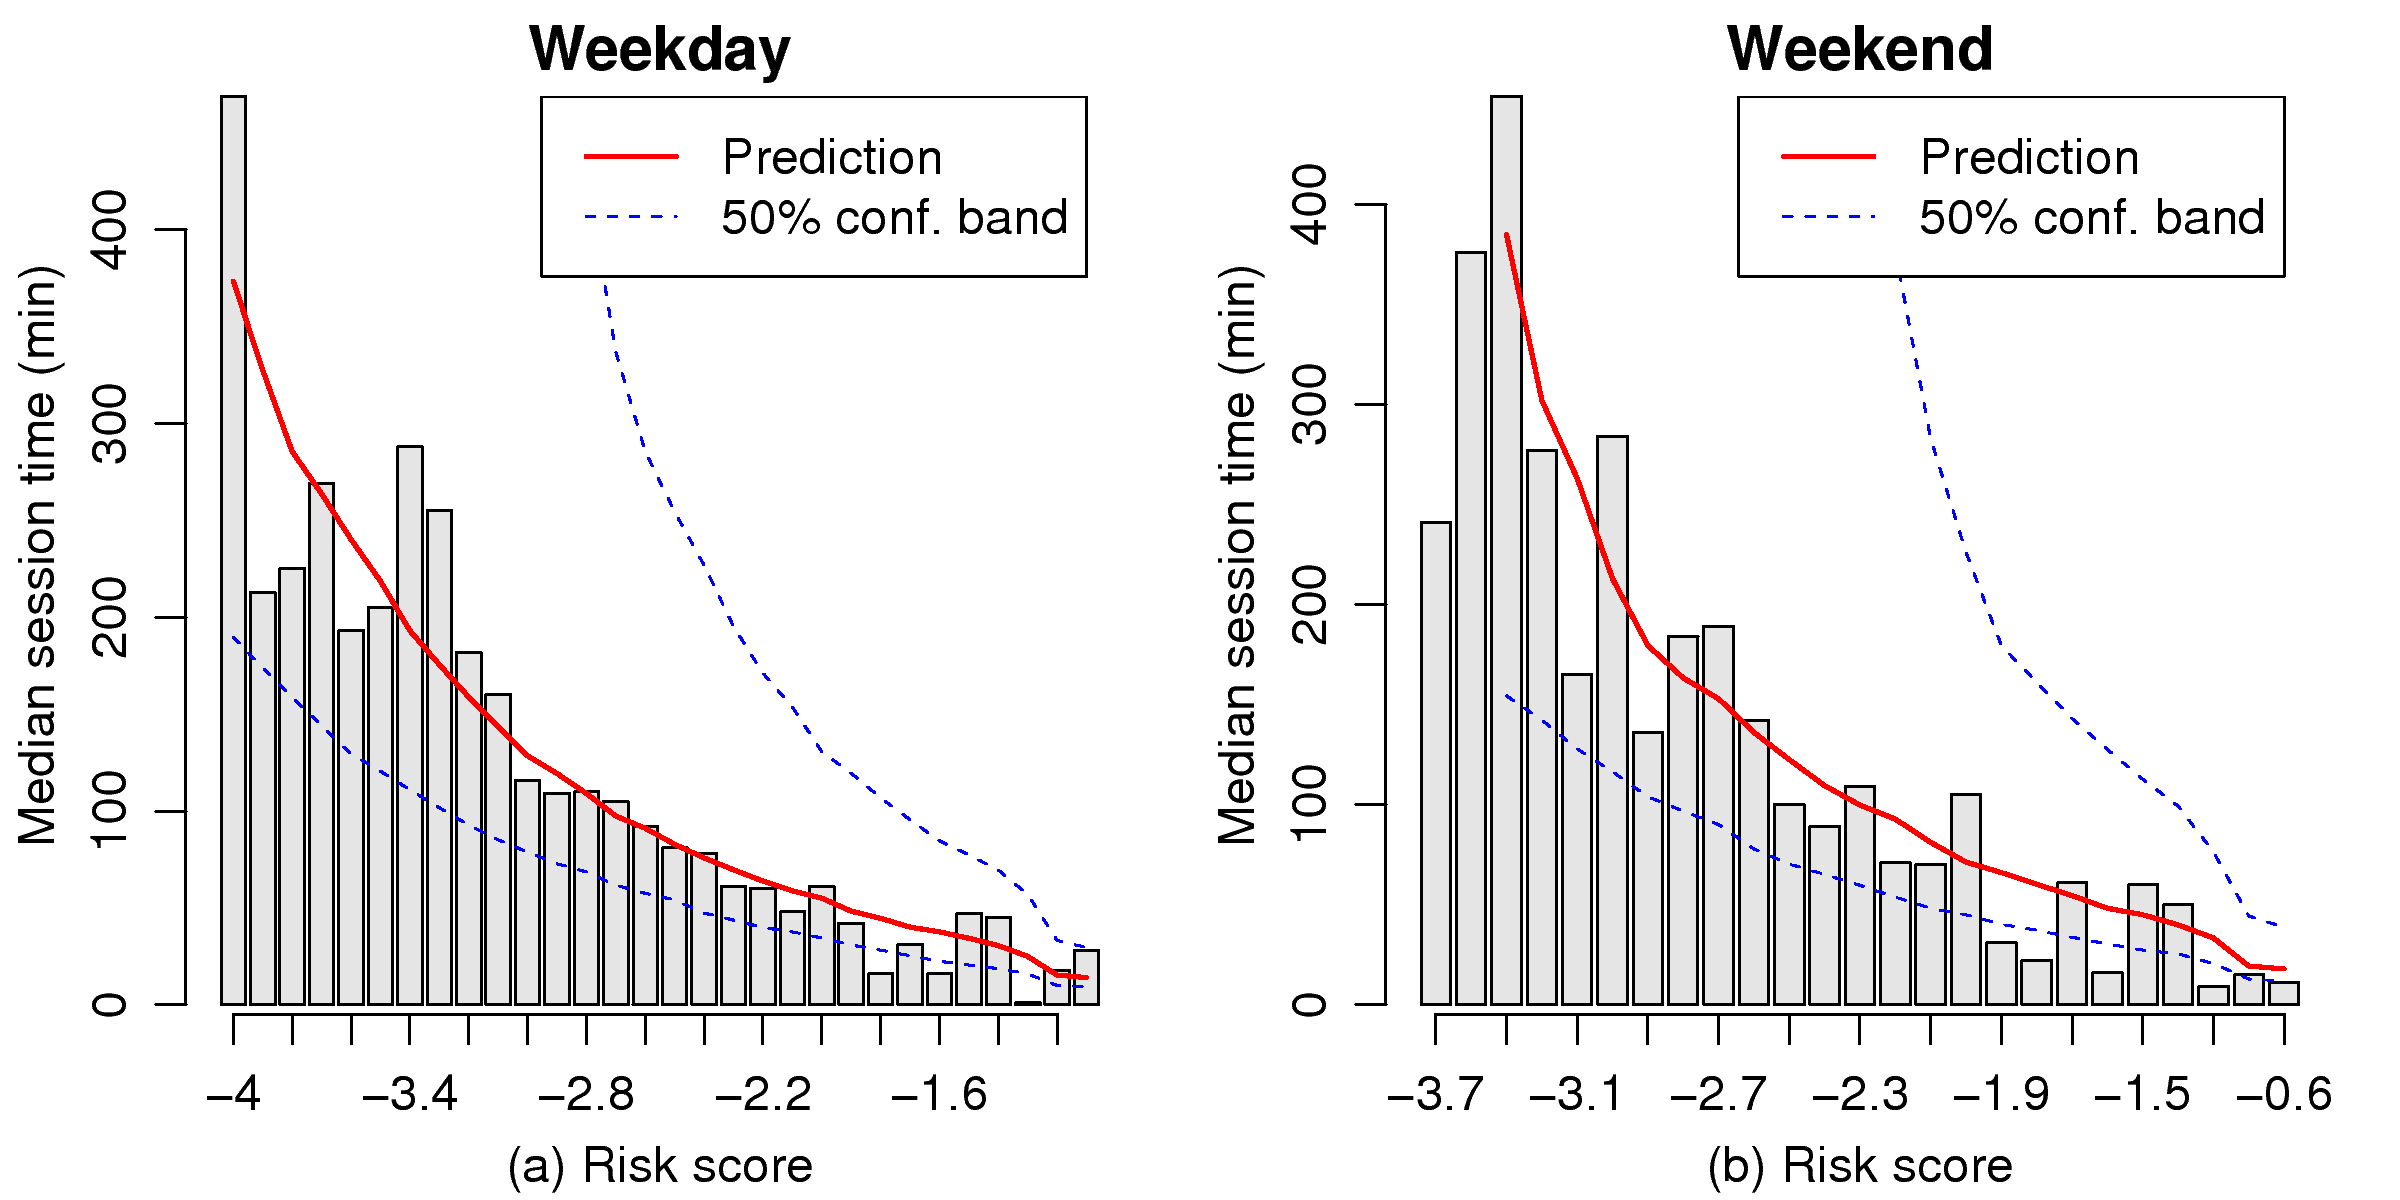
6.6 Model Validation and Interpretation
In Table VI, we present the estimated coefficients
along with their standard errors and significance values for the
final model. All covariates in the model are significant at level
0.05. We can validate the model by prediction; that is,
given a network QoS vector Z, we can predict the most
probable session time as the median time of the estimated survival
curve, i.e., inf{t:S(t|Z) ≤ 0.5}, while
S(t|Z) = exp(−H(t|Z)) is the computed survival
function for the session with risk vector Z. By the
relation, we sort and group all sessions by their risk scores,
βtZ, and predict session times based on the median
risk score in each group. The actual median times, predicted times,
and their 50% confidence bands are depicted in
Fig. 15. Note the confidence bands are asymmetric, since
the standard errors are in the form of hazard rates. We find that
the predicted times are rather close to the actual median times,
especially on weekdays, and for most groups the actual median times
are within the 50% predicted confidence bands.
Figure 15: Predicted times vs. actual median times for session
groups sorted by their risk scores
The coefficients in the model, as listed in Table VI,
can be interpreted by hazard ratios
(Equation 4). For example, assuming two players
enter a game at the same time and experience similar network
conditions, except for minimum RTT, where the minimum RTTs they have
are 70 ms and 50 ms respectively. The hazard ratio between
session times of these two players can then be computed by
exp((0.07 − 0.05)×19.2) ≈ 1.47, where 19.2 is the
coefficient of covariate rtt.min. That is, as long as both players
are still online, in every instant, the probability that player 1
will leave the game is 1.47 times the probability that player 2
will leave. By this rule, given QoS factors experienced by any two
players, we can compute the hazard ratio between their game
sessions.
6.7 Discussion
Since we have shown that network conditions significantly impact on
game playing times, one may ask: How do these QoS factors
influence the behaviors of game players "in practice"? To answer
this, we try to determine a factor's actual influence by predicting
session times with measured values, i.e., by applying the magnitude
of QoS factors from their distributions in our game trace, as shown
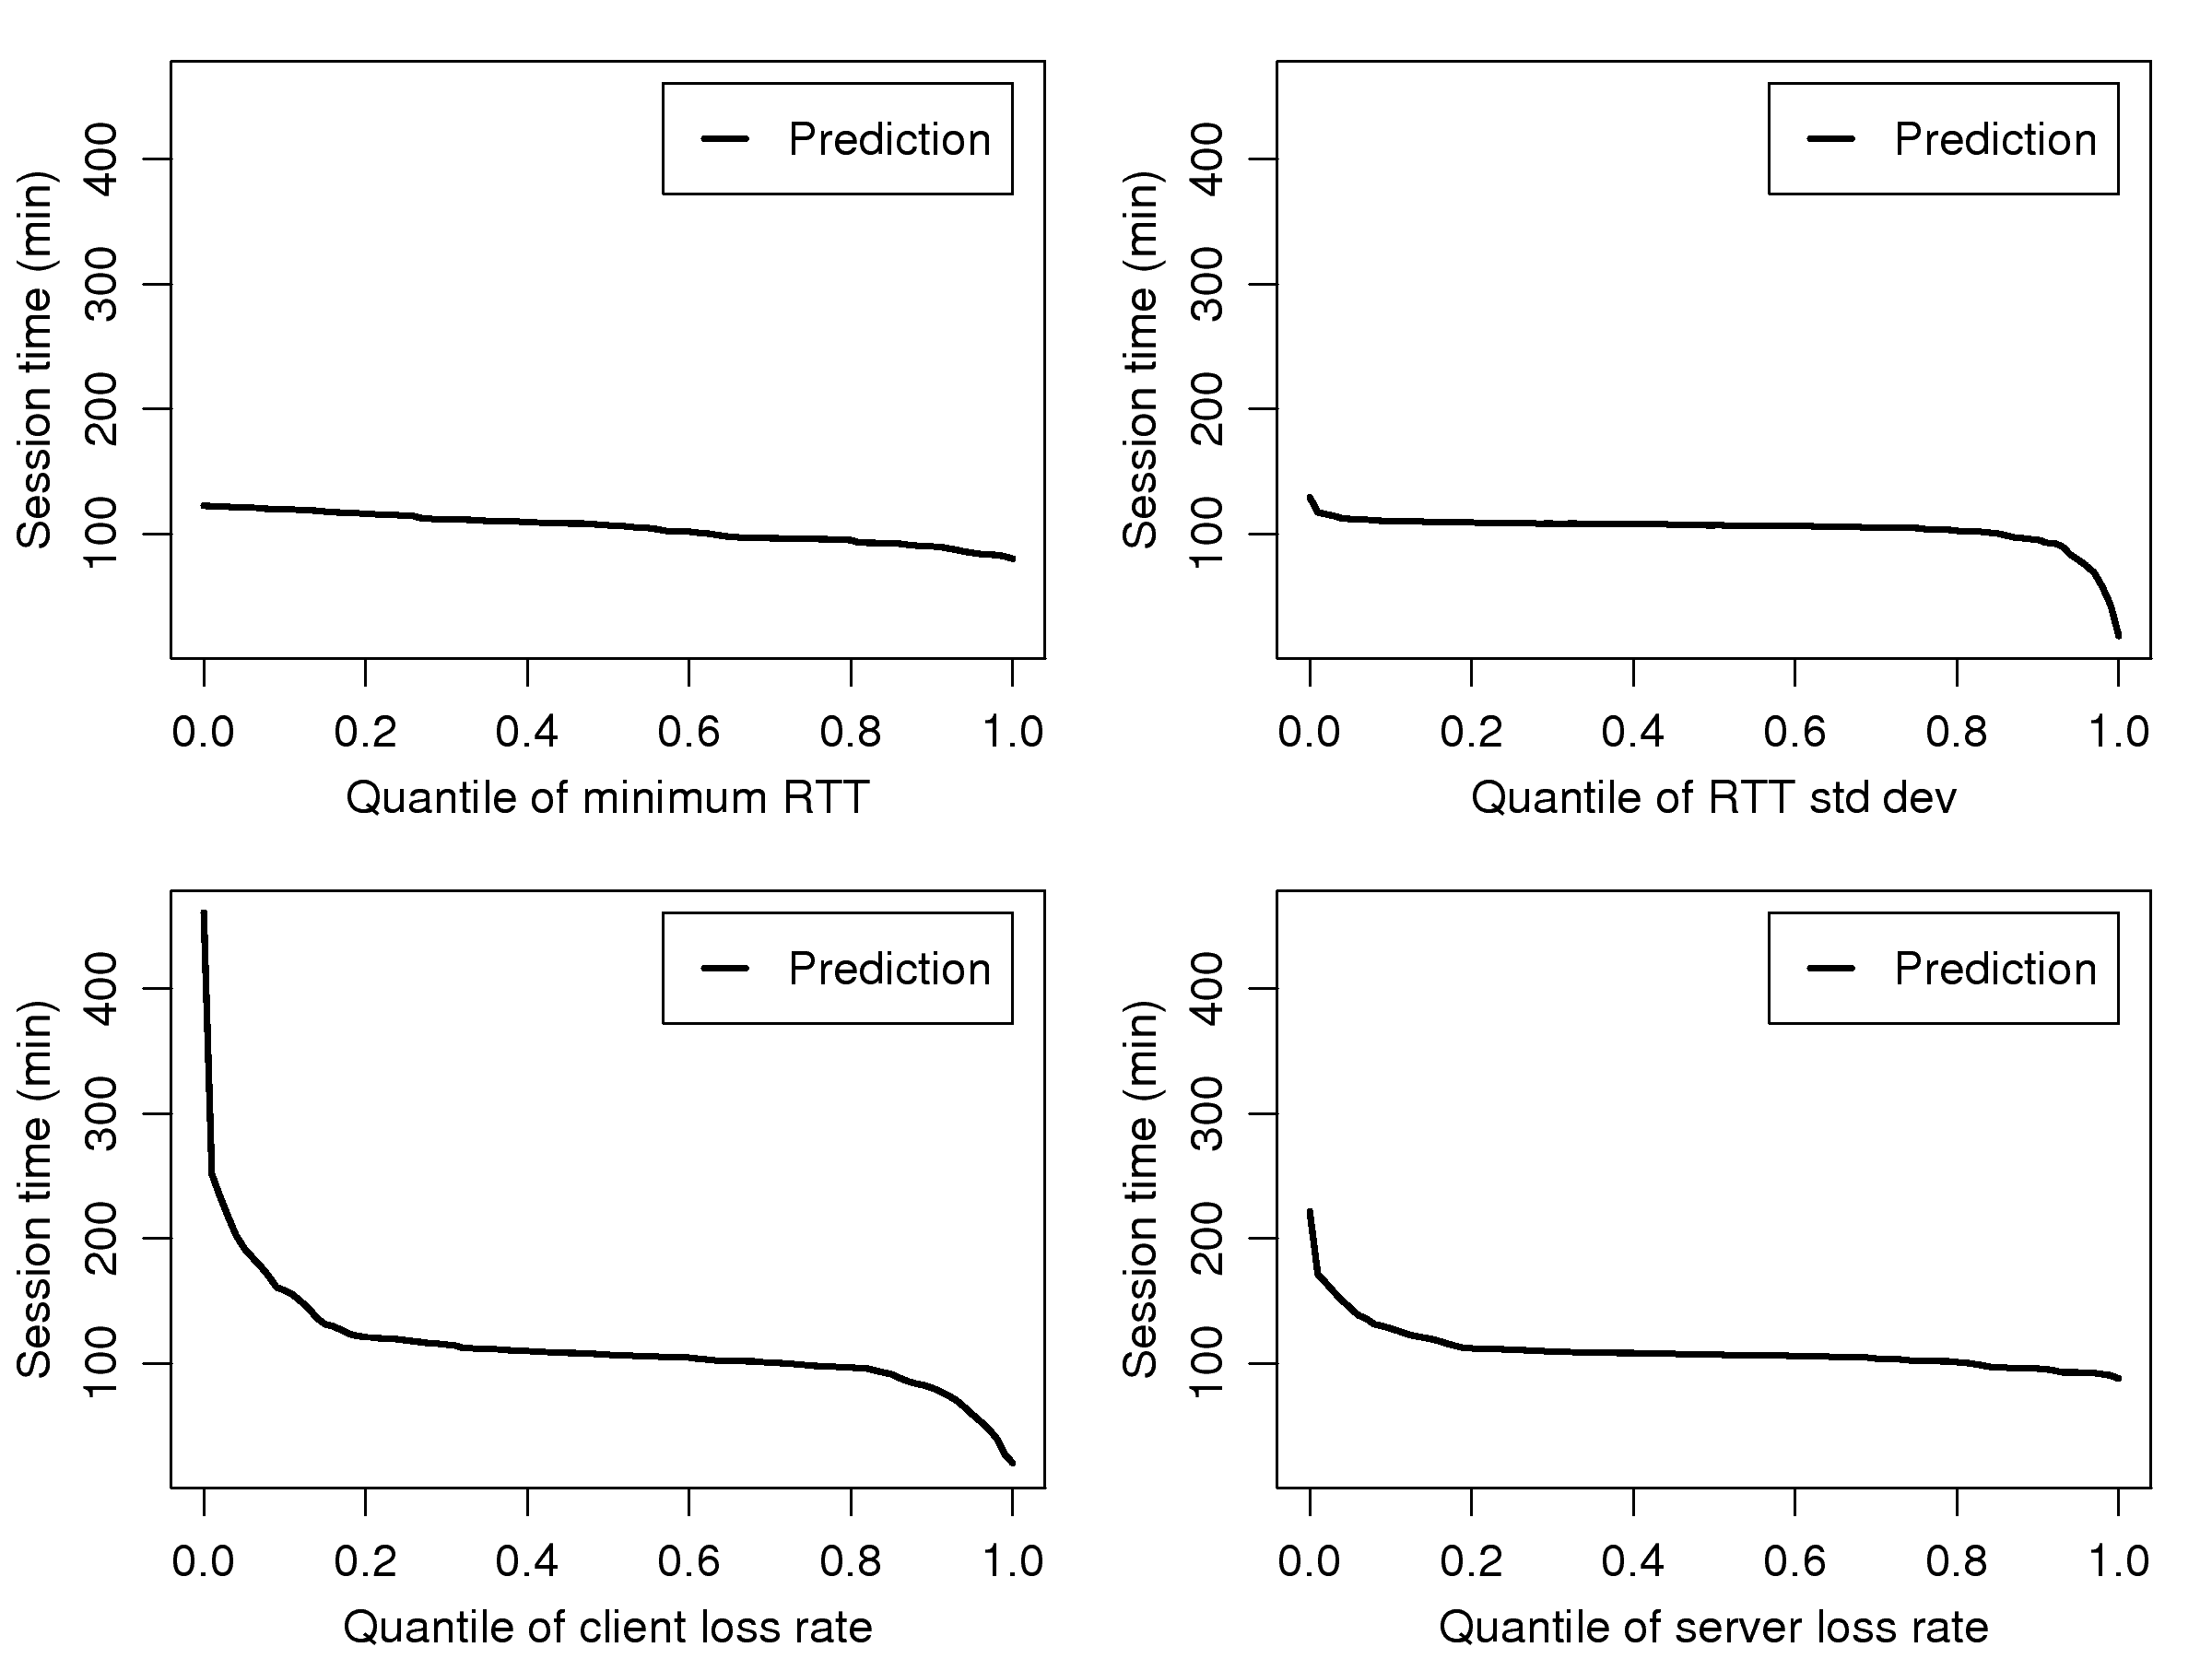
in Fig. 16. When observing a QoS factor, the other
factors are set equal to their respective medians.
Note that we purposely place four curves separately, since the
predictions for different factors cannot be compared directly. We
observe that the RTT std dev and client loss rate show rapidly
declining trends at their tails (top quantiles). Specifically,
sessions with the top 10% RTT std dev ( ≥ 80 ms) are affected
by RTT fluctuations (also known as delay jitters) much more than
other sessions. Similarly, sessions with the top 20% client loss
rate ( ≥ 0.5%) are affected by client packet loss much more
than other sessions. We remark that RTT fluctuations and
client packet loss are two major potential opponents to a smooth
game playing experience because of their strong impact at high
quantiles.
Figure 16: The influence of each covariate in practice, i.e.,
predicting duration by quantiles of QoS factors in our game
trace
We can also determine the factors' actual influence by the ratio of
predicted duration between different quantiles. As shown in
Table VII, the predicted duration of 1%
percentile client loss rate ( ≈ 0.002%) is 9.3 times more
than that of 99% percentile client loss rate ( ≈ 25%)! In
contrast, the same quantity for the minimum RTT is
only 1.5.
We can also combine the influence of network latency and loss, the
1% versus 99% scenario shows that network loss has a much
higher impact (ratio of 6.8) than latency (ratio of 2.6).
Table 7: Ratio of predicted duration between different
quantiles
Ratio
rtt.min
rtt.sd
closs
sloss
25% vs. 75%
114:96=1.2
109:105=1.0
118:98=1.2
111:102=1.1
5% vs. 95%
121:85=1.4
112:79=1.4
192:59=3.3
144:93=1.6
1% vs. 99%
122:82=1.5
117:43=2.7
252:27=9.3
171:90=1.9
Ratio
rtt.min + rtt.sd
closs + sloss
25% vs. 75%
128:123=1.0
173:147=1.2
5% vs. 95%
132:95=1.4
271:69=3.9
1% vs. 99%
142:54=2.6
373:55=6.8
Figure 17: Relative influence of different QoS factors in each
session
Another of our concerns is to quantify the relative influence
of QoS factors. We assess their relative weights by computing the
risk score for each QoS factor with the other factors set to their
respective minimum values. The relative influence of each QoS factor,
which is normalized by a total risk score of 100, is shown in
Fig. 17. On average, the degrees of players'
"intolerance" to minimum RTT, RTT std dev, client loss rate, and
server loss rate are in the proportion of 1:2:11:6. That is, a
player's decision to leave a game due to unfavorable network
conditions is based on the following levels of intolerance: client
packet loss (55%), server packet loss (30%), RTT fluctuations
(10%), and minimum RTT (5%).
The above results highlights the fact that delay jitters are
less tolerable than absolute delay. While most earlier
QoS-sensitivity studies completely neglected the impact of delay
jitters, we argue they are more relevant in players' network
experience. Therefore, while current network games primarily rely on
a "ping time" to select a server for a smooth game play, delay
jitters should also be considered in the server selection process.
We also find that server packet loss is relatively more
tolerable than client packet loss.
We consider this to be reasonable, since client packet loss delays
players' commands to the server, while server packet loss delays the
response and state updates. Nowadays MMORPGs are server-centric so
that no command becomes valid until it has been processed by the
server. Therefore, delaying players' commands, such as attack or
casting spells in combat, is much more annoying than just delaying
the response and screen updates.
Comparing the influence of network loss and network latency, we find
a ratio of 17:3, or nearly six to one. However, in an earlier
study on Unreal Tournament 2003[3], the
authors reported that though network latency in a typical range (0
ms - 200 ms) has a statistically weak impact on user performance,
network loss of a typical range
( < 6%) has no impact on user performance.
We consider that the difference between our result and those
of [3] is due to the choice of underlying
transport protocol. That is, while most FPS games transmit messages
via UDP, many MMORPGs, including ShenZhou Online, use TCP. Since TCP provides
in-order delivery and congestion control, a lost packet will cause
the subsequent packets to be buffered until it is successfully
delivered, and, furthermore, cut down TCP's congestion window. On
the other hand, packet loss incurs no overhead in UDP. In short, for
TCP-based online games, packet loss incurs additional packet
delay and delay jitters, and therefore causes further annoyance to
players. From this point of view, and because of TCP's high
communication overhead [5], we consider that more
lightweight protocols would be more appropriate for realtime
interactive network games.
7 Conclusion
In this paper, we analyze the lifetimes of game sessions derived
from ShenZhou Online, a commercial MMORPG. Using a survival analysis approach,
we investigate the relationship between network QoS and session
times, and find that both network delay and network loss
significantly affect a player's willingness to continue a game or
leave it. For ShenZhou Online, the degrees of player "intolerance" of minimum
RTT, RTT jitter, client loss rate, and server loss rate are in the
proportion of 1:2:11:6. This indicates that: 1) while many
network games provide "ping time" to players to facilitate server
selection, it would be more useful to provide information about
delay jitters; and 2) players are much less tolerant of network loss
than delay. This is due to the game designer's decision to transfer
data in TCP, where packet loss incurs additional delay and delay
jitters, and therefore causes further annoyance to players.
Acknowledgments
This work would not have been possible without the extensive traffic
trace. The authors are much indebted to the following people who
helped us gather the trace: Tsing-San Cheng, Lawrence Ho, Chen-Hsi
Li, and especially to Yen-Shuo Su, who made the datasets available.
The authors also wish to thank the anonymous referees for their
constructive criticisms.
References
[1]
"Gametrics weekly Korea MMORPG population survey." [Online]. Available:
http://www.4gamer.net/news.php?url=/specials/gametrics/gametrics.shtml
[2]
G. Armitage, "An experimental estimation of latency sensitivity in multiplayer
Quake 3," in 11th IEEE International Conference on Networks (ICON
2003), 2003.
[3]
T. Beigbeder, R. Coughlan, C. Lusher, J. Plunkett, E. Agu, and M. Claypool,
"The effects of loss and latency on user performance in Unreal
Tournament 2003," in NetGames '04: Proceedings of the 3nd Workshop
on Network and System Support for Games. ACM Press, 2004, pp. 144-151.
[4]
F. Chang and W. chang Feng, "Modeling player session times of on-line games,"
in NetGames '03: Proceedings of the 2nd Workshop on Network and System
Support for Games. ACM Press, 2003,
pp. 23-26.
[5]
K.-T. Chen, P. Huang, and C.-L. Lei, "Game Traffic Analysis: An MMORPG Perspective," Computer Networks, Article In Press.
[6]
W. S. Cleveland, "LOWESS: a program for smoothing scatterplots by robust
locally weighted regression," The American Statistician, vol. 35,
no. 54, 1981.
[7]
D. R. Cox and D. Oakes, Analysis of Survival Data. Chapman & Hall/CRC, June 1984.
[8]
D. R. Cox and E. J. Snell, "A general definition of residuals (with
discussion)," Journal of the Royal Statistical Society, vol. B 30,
pp. 248-275, 1968.
[9]
DFC Intelligence, "The online game market 2004."
[10]
D. P. Harrington and T. R. Fleming, "A class of rank test procedures for
censored survival data," Biometrika, vol. 69, pp. 553-566, 1982.
[11]
T. Henderson, "Latency and user behaviour on a multiplayer game server," in
Proceedings of the Third International COST Workshop (NGC 2001). Springer-Verlag, 2001, pp. 1-13.
[12]
T. Henderson and S. Bhatti, "Modelling user behaviour in networked games," in
MULTIMEDIA '01: Proceedings of the Ninth ACM International Conference
on Multimedia. ACM Press, 2001, pp.
212-220.
[13]
--, "Networked games: a QoS-sensitive application for
QoS-insensitive users?" in RIPQoS '03: Proceedings of the ACM
SIGCOMM Workshop on Revisiting IP QoS. ACM Press, 2003, pp. 141-147.
[14]
J. D. Kalbfleisch and R. L. Prentice, The Statistical Analysis of Failure
Time Data, 2nd ed.
Wiley-Interscience, August 2002.
[15]
E. L. Kaplan and P. Meier, "Nonparametric estimation from incomplete
observations," Journal of the American Statistical Association,
vol. 53, pp. 437-481, 1958.
[16]
J. Nichols and M. Claypool, "The effects of latency on online madden NFL
football," in NOSSDAV '04: Proceedings of the 14th International
Workshop on Network and Operating Systems Support for Digital Audio and
Video. ACM Press, 2004, pp. 146-151.
[17]
L. Pantel and L. C. Wolf, "On the impact of delay on real-time multiplayer
games," in NOSSDAV '02: Proceedings of the 12th International Workshop
on Network and Operating Systems Support for Digital Audio and Video. ACM Press, 2002, pp. 23-29.
[18]
N. Sheldon, E. Girard, S. Borg, M. Claypool, and E. Agu, "The effect of
latency on user performance in Warcraft III," in NetGames '03:
Proceedings of the 2nd Workshop on Network and System Support for
Games. ACM Press, 2003, pp. 3-14.
[19]
T. M. Therneau and P. M. Grambsch, Modeling Survival Data: Extending the
Cox Model, 1st ed. Springer, August
2001.
[20]
"ShenZhou Online," UserJoy Technology Co., Ltd. [Online].
Available: http://www.ewsoft.com.tw/
Footnotes:
1. This research is supported in part by the National Science Council of the
Republic of China under grant NSC 94-2213-E-002-043.
Sheng-Wei Chen (also known as Kuan-Ta Chen) http://www.iis.sinica.edu.tw/~swc
Last Update September 28, 2019