Online gaming is one of the most profitable businesses on the
Internet. Of all the genres of online games, MMORPGs (Massive
Multiplayer Online Role Playing Games) have become the most popular
among network gamers, and now attract millions of users who play in
an evolving virtual world simultaneously over the Internet. To gain
a better understanding of game traffic and contribute to the
economic well-being of the Internet, we analyze a
1,356-million-packet trace from a sizeable MMORPG called ShenZhou Online. This
work is, as far as we know, the first formal analysis of MMORPG
server traces.
We find that MMORPG and FPS (First-Person Shooting) games are
similar in that they both generate small packets and require low
bandwidths. In practice, the bandwidth requirement of MMORPGs is
the lower of the two due to less real-time game playing. More
distinctive features are the strong periodicity, temporal locality,
irregularity, and self-similarity observed in MMORPG traffic. The
periodicity is due to a common practice in game implementation,
where game state updates are accumulated within a fixed time window
before transmission. The temporal locality in game traffic is
largely due to the game's nature, whereby one action leads to
another. The irregularity, which is unique to MMORPG traffic, is
due to the diversity of the game's design so that the behavior of
users can vary drastically, depending on the quest at hand. The
self-similarity of the aggregate traffic is due to the heavy-tailed
active/idle activities of individual players. Moreover, we show that
the arrival of game sessions within one hour can be modelled by a
Poisson model, while the duration of game sessions is heavy-tailed.
Internet Measurement, MMORPG, Network Games, Traffic Analysis
1 Introduction
MMORPGs (Massive Multiplayer Online Role Playing Games) have become
extremely popular among network gamers, millions of whom now play in
an evolving virtual world simultaneously over the Internet. The
number of active player subscriptions doubled between July 2004 and
June 2005 to a 500-million player base [2]. Thus, the
amount of game traffic on the Internet has become increasingly
significant. According to a report on backbone traffic
analysis [3], about 3%-4% of the traffic
can be attributed to six popular games. A better understanding of
game traffic is vital, given its significant share of overall
traffic and the dissimilar nature of games to dominant Internet
applications such as the World Wide Web, peer-to-peer file sharing,
and streaming.
We focus on MMORPGs for two reasons. First, they are now the most
prominent genre of online games, especially
in Asia. In Taiwan, Gamania1 (the operator of the popular game
Lineage2) owns
more than 4,000 Mbps of dedicated links3 for game traffic.
According to Game Flier4, the top game, Ragnarok
Online, claimed a record of 370,000 users playing online
simultaneously in December, 2004; about 1.5% of Taiwan's
population. The second reason is that most MMORPGs exchange messages
using TCP. Although TCP is not designed for real-time communication,
it is not yet clear whether it is unsuitable for the MMORPG traffic
transmission. To the best of our knowledge, this work is the first
to analyze and characterize MMORPG traffic.
We trace ShenZhou Online [4], a commercial, mid-sized MMORPG, and
analyze a 1,356-million-packet trace. We thoroughly analyze the
game's traffic from a number of aspects: traffic patterns within
individual connections, the characteristics of aggregate traffic,
and session characteristics. Our analysis focuses primarily on the
temporal dependence of traffic processes, periodicity, and
variability, and the physical explanations and implications of such
effects. The major findings can be summarized as follows:
The average bandwidth requirement per client is about 7
Kbps, which is much lower than the 40 Kbps average observed
for Counter-Strike [5]. We believe the
lower bandwidth requirement is due to the relatively slow pace of
MMORPGs.
Traffic in both directions exhibits short-term temporal
dependence within connections. In client traffic (traffic from the
client to the server), the dependence is due to the clustering
nature of user actions. The same effect in server traffic is caused
by the spatial locality of the number of characters near the
player character, which shows up in terms of the temporal locality
in traffic as the player character moves continuously on the map.
Temporal dependence still exists in aggregate client traffic.
We believe this is due to the global events in games, which
in turn cause the "flash crowd" effect. Furthermore, the aggregate
traffic in both directions exhibits strong periodicity, which
implies that game processing for all clients is synchronized.
Packet bursts due to the periodic state update mechanism do cause
network performance problems, i.e., superfluous packet loss.
Game traffic burstiness is much less than in TELNET traffic,
for both individual connections and aggregate traffic. At the same
time, the aggregate game traffic exhibits self-similarity
over a wide range of time scales (for at least two hours), which
could be explained by the heavy-tailed active/idle periods of
individual players.
The arrival of game sessions within one hour can be modelled
by a homogeneous Poisson model. The duration of both game and
map sessions is shown to be heavy-tailed, which could be a
consequence of the game's nature.
For MMOGs, although the bandwidth requirement of each game client
might be small, the number of concurrent connections could be very
large. For instance, the record of 370,000 players online
simultaneously (Ragnarok Online, Taiwan, 2004) implies that
at least 3.7 Gbps of bandwidth is required, assuming each client
needs 10 Kbps on average. Furthermore, according to our analysis,
the traffic of concurrent connections to a game are positively
correlated, rather than independent, and the aggregate game traffic
exhibits the self-similar property; therefore, the instantaneous
peak rate can be much higher than the estimated average rate. For
the above reasons, we believe that understanding game traffic is
especially critical for network planning at the game server side and
not negligible for the game providers and ISPs as the online game
population continues to increase rapidly [2].
In remainder of this paper, we discuss these issues in detail.
Section 2 describes related works and the game
ShenZhou Online. We discuss the trace measurement methodology
and trace summary in Section 3. In
Section 4, we analyze the traffic patterns of
individual connections. We then investigate the behavior of
aggregate traffic in Section 5. Next, in
Section 6, we analyze the session-level
characteristics of both TCP connections and game sessions. Finally,
in Section 7, we present our conclusions.
2 Background
2.1 Related Work
As network games are becoming major contributors to overall Internet
traffic, a great deal of effort is being devoted to the analysis and
modeling of network game traffic. Bangun [6]
analyzed a network trace captured at an Internet café for two
LAN games, Quake and Starcraft. Their work focused on
how payload sizes and inter-packet times vary with the number of
players. Later, Bangun and Dutkiewicz proposed models of payloads
and inter-packet times based on a trace of another LAN game called
Starsiege Tribes. Borella proposed source models for the
popular FPS (First-Person Shooting) game Quake, where the
packet interarrival times and packet sizes are modelled as extreme
distribution, exponential distribution, or
deterministic [7]. A similar work by Färber
characterized traffic for another FPS game called
Counter-Strike [8].
Feng [5] analyzed a 500-million-packet
trace of a busy Counter-Strike server. Their study revealed
that game traffic is highly predictable; however, it contains bursts
of tiny packets. Though MMORPGs and FPS games are very different
game genres, we find they are similar in terms of packet size and
periodicity. In [5], the authors further
evaluated the impact of tiny packets on network infrastructures by a
pressure test on a commercial off-the-shelf NAT device. The test
indicated that the device cannot handle such packets well.
2.2 About ShenZhou Online
ShenZhou Online is a mid-scale, commercial MMORPG that is popular in
Taiwan [4], where there are thousands of players online
at any one time. To play, users purchase "game points" from a
convenience store or online. A screen shot of ShenZhou Online is shown in
Fig. 1. The character played by the author is the
man in the center of the screen with a smiling face above him. He is
in a typical marketplace, where the other players keep stalls. As is
normal in MMORPGs, a player can engage in fights with the other
players or with random creatures, train himself for special skills,
participate in marketplace commerce, or take on a quest.
Figure 1: A screen shot of ShenZhou Online
3 Trace Collection
With the help of the ShenZhou Online staff, we set up a traffic monitor beside
the game servers. The monitor was attached to a layer-4 switch
upstream of the LAN containing the game servers (we call it the
"game LAN"). The port forwarding capability of the tapped layer-4
switch was enabled so that all inbound/outbound game traffic was
forwarded to our monitor as a copy. To minimize the impact of
monitoring, all remote management operations were conducted via an
additional network path, i.e., the game traffic and management
traffic did not interfere with each other. The network topology and
setup of the game servers and the traffic monitor are shown in
Fig. 2.
The traffic monitor was a FreeBSD PC equipped with 1.5 GHz Pentium
4 and 256 MB RAM. We used tcpdump [9] with the
kernel built-in BPF to obtain traffic traces. Because of the
restrictions of the network topology, the switch forwarded all
traffic sent to and from the game LAN, including non-game-playing
traffic like HTTP, DNS, and SMB packets. These unwanted traffic
types were filtered out using the filtering support of
tcpdump. Out of consideration for data privacy and storage,
only IP and TCP headers were recorded.
We randomly chose a subset of game sets in each trace, and only
packets belonging to the selected game sets were logged. A game set,
which is logically a "game server" from a player's viewpoint,
comprises an entry server, several map servers, and a database
server. All game sets are equivalent in content, but
isolated. The reason for providing identical game sets is to
distribute the workload over a number of servers with limited game
content, e.g., terrain, missions, and creatures in the virtual
world. We took two packet traces, N1 and N2, which
recorded traffic for two and three game sets, respectively. The
traces, summarized in Table 1, spanned 8 and 12
hours respectively, and contained more than 1,356 million packets
in total.
Figure 2: Network setup for traffic measurement
In the packet-level analysis presented in this paper, except for
packets (less than ten) discarded due to TCP checksum errors, all
recorded game packets are used. The user authentication process is
through separate TCP connections and ports; thus, non-playing
activities, such as login attempts and subscription status
validation, are not included in our analysis. On the other hand, for
session-level analysis (Section 6), we treat a TCP
connection as a legitimate map session if it satisfies the following
conditions: 1) its presence time (observed by our monitor) is longer
than ten seconds; and 2) it comprises at least ten packets in both
directions. No connections were trimmed, even if some of them were
partially observed by the monitor.
Table 1: Summary of Game Traffic Traces
ID
Date
Time
Period
Drops†
Conn. (Cens.)
Pkt. (in / out)
Bytes (in / out)
N1
8/29/04
15:00
8 hr.
0.003%
57,945 (6.5%)
342M / 353M
4.7TB / 27.3TB
N2
8/30/04
13:00
12 hr.
?‡
54,424 (3.5%)
325M / 336M
4.7TB / 21.7TB
† This column gives the kernel drop count reported by tcpdump.
‡ The reported kernel drop count was zero, but we actually found some packets are dropped.
4 Traffic Characteristics of Individual Connections
In this section, we investigate traffic patterns embedded in
individual connections. We first examine the size of packets sent by
either game clients or servers, and then analyze the packet load and
bandwidth usage of each client. Next, we search for patterns in the
inter-packet times within each connection. Lastly, the peak rate and
traffic burstiness over a range of time scales are investigated.
For the sake of brevity, we denote packets sent by game clients,
including data packets and TCP acknowledgement packets, as "client
packets", and all traffic sent by clients as "client traffic."
The terms "server packets" and "server traffic" are similarly
defined.
4.1 Packet Size
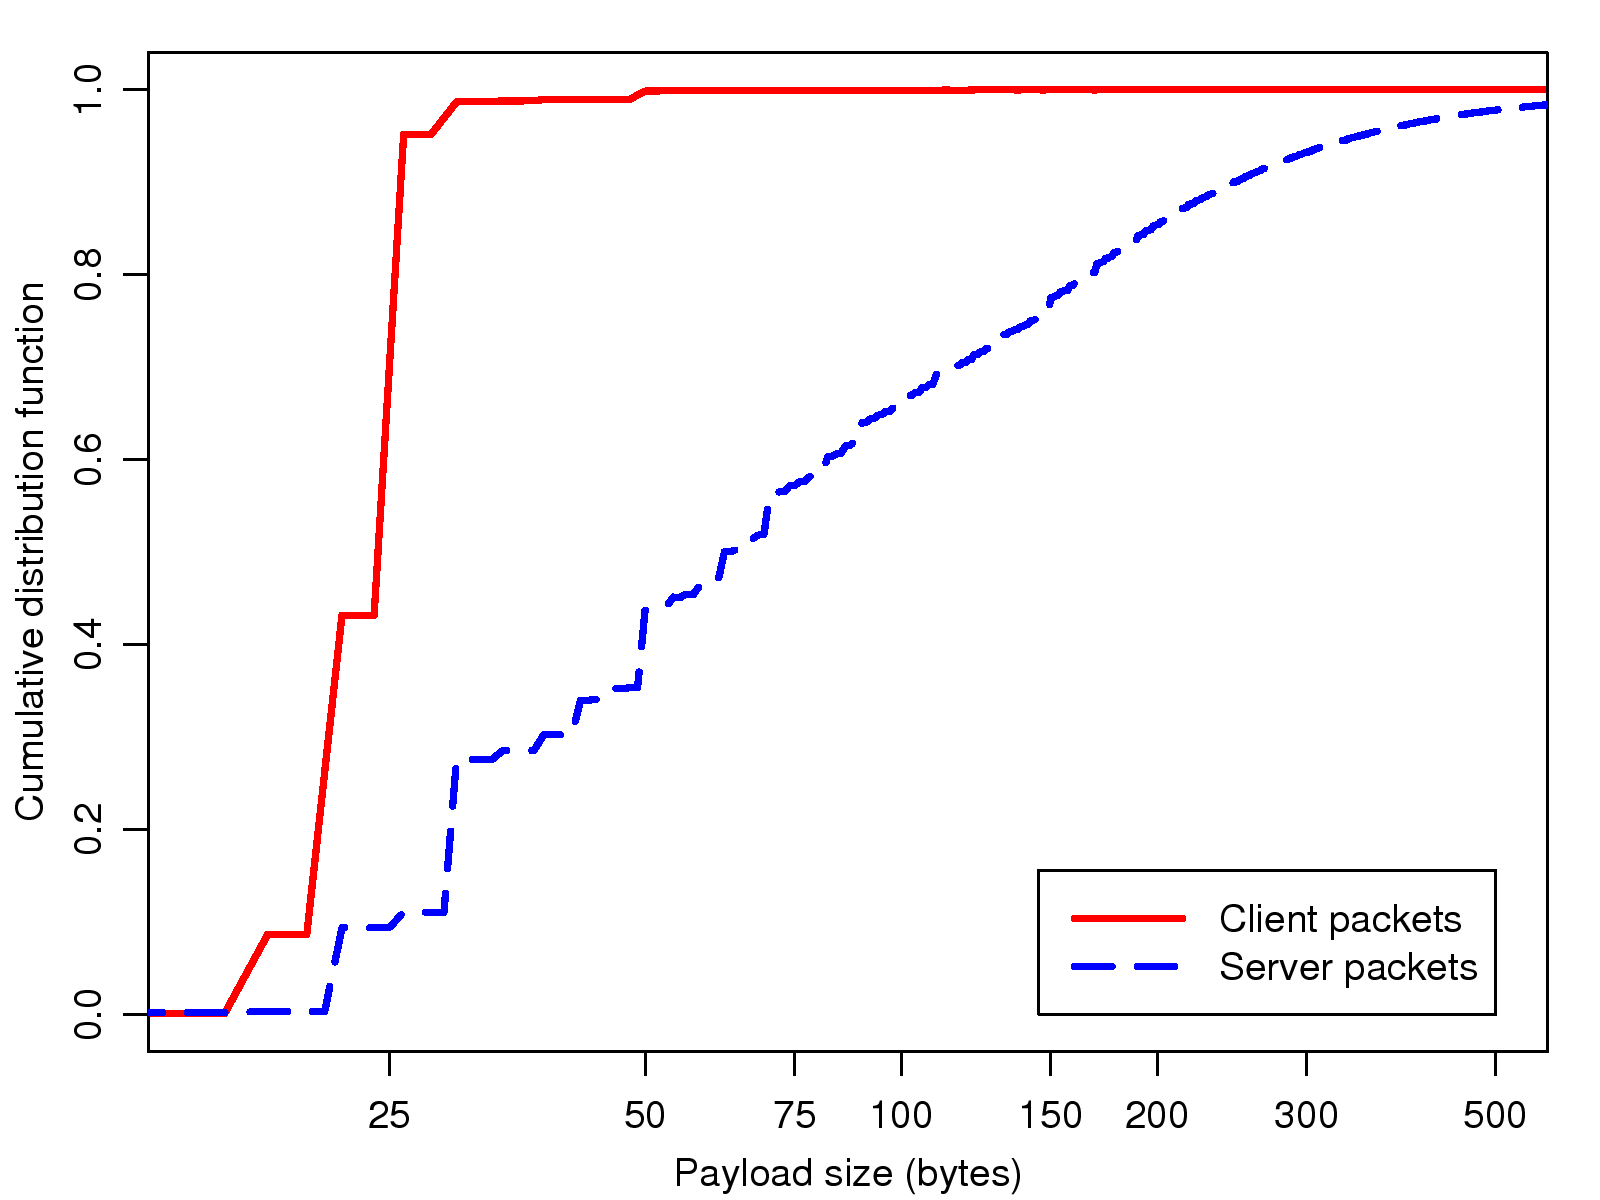
Fig. 3 shows the cumulative distribution function
(CDF) of the payload size, which is the packet size without the
TCP/IP header of 40 bytes. Pure TCP ack packets do not count. As
the figure shows, client and server packets are drastically
different in payload size. The discrepancy conforms to our
intuition, since client packets contain one player's
commands, while server packets convey nearby characters' actions and
states as well as system messages. The client packets are extremely
small: 98% of client packets have a payload size smaller
than 32 bytes. The two modes 23 and 27 bytes, which comprise
36% and 52% of packets respectively, show that user actions
are dominated by a few popular commands, such as "walk" and
"attack." On the other hand, server packets have a much wider
distribution with an average payload size of 114 bytes. The
payload size distribution generally agrees with the finding
in [5] that the packet size in game traffic is
generally much smaller than has been observed at Internet exchange
points, where the mean packet size is above 400
bytes [3].
According to the delay ack option [10], ack packets are
sent for alternate TCP segments received on a connection, unless the
delayed ack timer (usually set to 200 ms) has expired. Thus, in
ideal circumstances, the ratio of pure ack packets should take up
approximately one-third. However, 38% of the packets in our trace
are pure TCP acks. We find that this relatively high ratio is due to
the fact that game packets are generated at a low rate, so it is
probable that no further packets will arrive before the expiration
of the delayed ack timer.
Furthermore, for overall client traffic, we can calculate the
overhead of TCP/IP headers and TCP acks by the ratio of bytes used.
The cost is noteworthy: TCP/IP headers comprise 73%, where
pure TCP acknowledgement packets are responsible for 30%. Note
that the former includes the latter. The average packet size is
84 bytes if we count the overall game traffic. While routers and
other network devices are often designed on the assumption that the
average packet size is between 125 and 250
bytes [11], the popularity of online games may
challenge the processing power of network devices because of the
large number of tiny game packets.
Figure 3: Payload size distribution
4.2 Packet Load and Bandwidth Usage
To determine the bandwidth usage of each game client, we compute the
average packet load and average throughput rate for each connection.
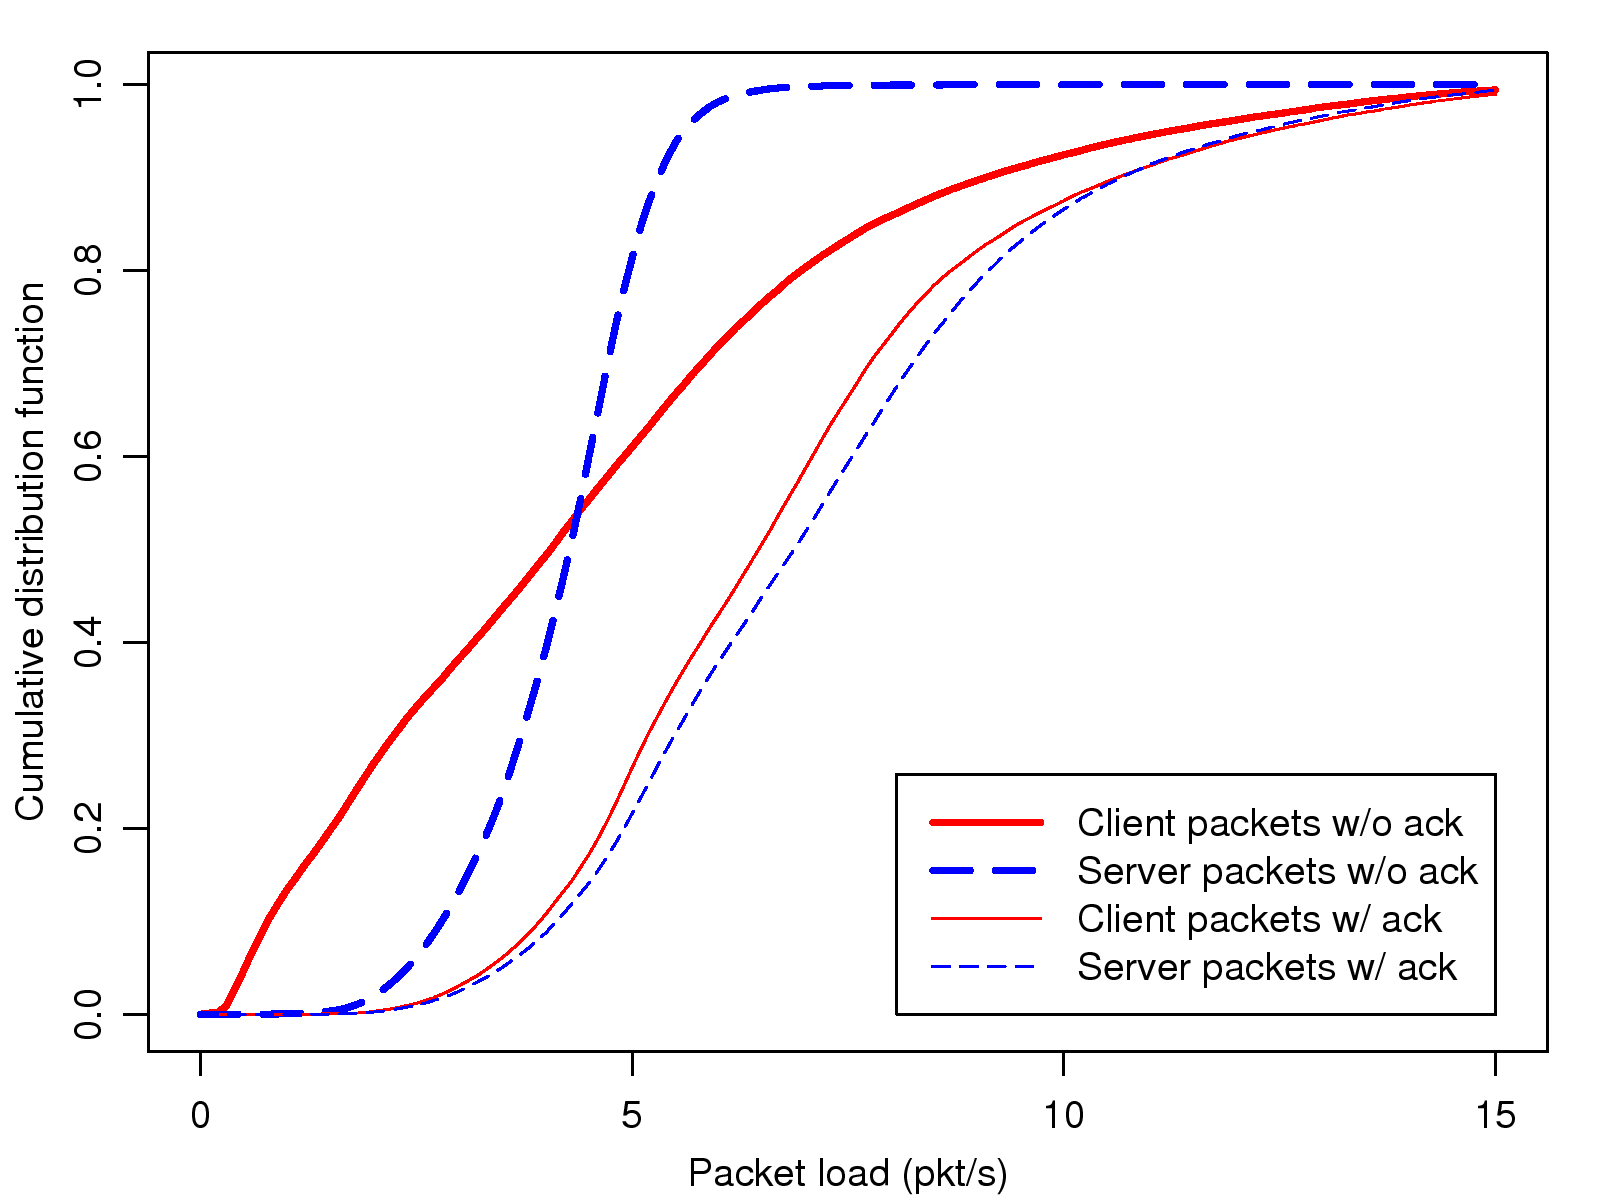
As shown in Fig. 4 and Fig. 5, the
packet load and bandwidth needed to play an MMORPG are surprisingly
low. For most connections, the average server packet rates
are lower than 5 pkt/sec. Even by considering TCP acks, 99% of
connections have a packet load less than 15 pkt/sec in both
directions.
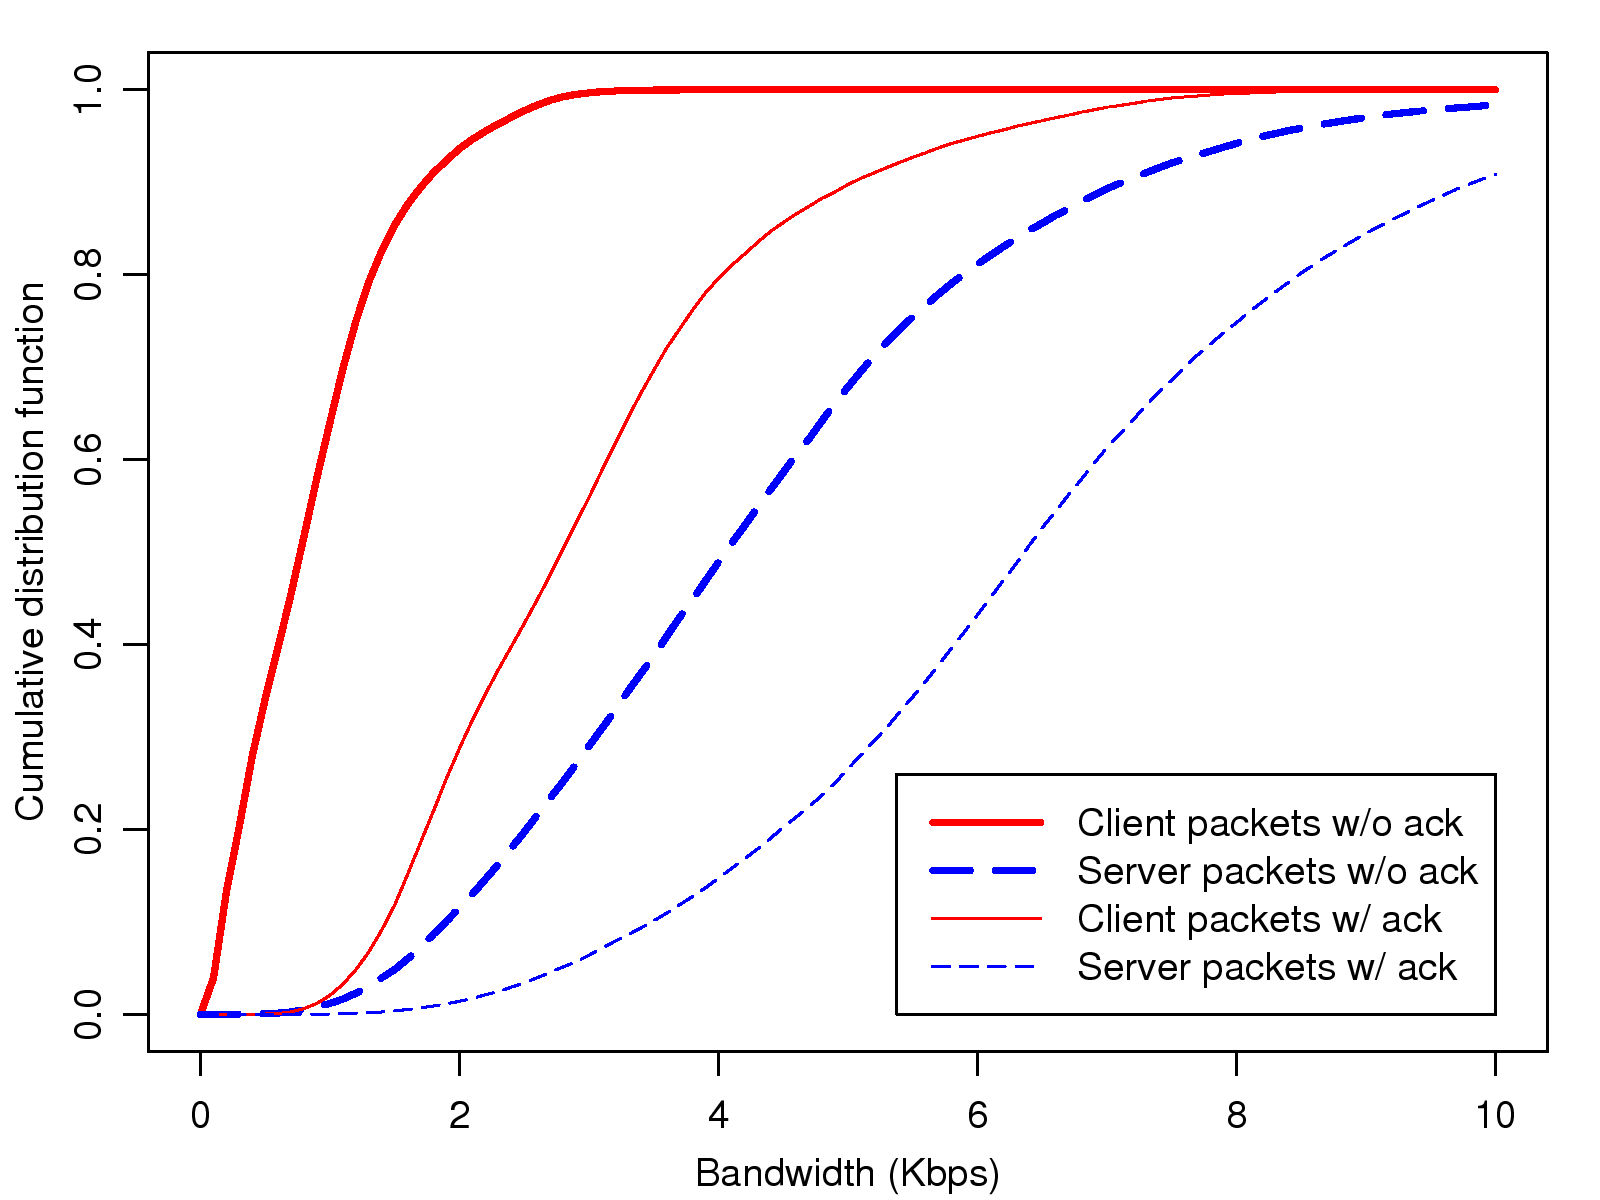
With the low packet rate and small payload, the bandwidth
requirement of an MMORPG is even lower than the narrowest last-mile
link, 56 Kbps modem. Nearly all connections consume less than 3
Kbps for client data packets, and less than 8 Kbps when TCP acks
are considered. Although server traffic uses more bandwidth, only
7 Kbps is required on average. The overall bandwidth usage is
much lower than the average 40 Kbps needed by
Counter-Strike [5]. We believe the
difference is due to the game's nature; that is, MMORPGs are
relatively slow-paced compared to FPS games, which usually require
players to make sub-second decisions. On the other hand, the
bandwidth usage of MMORPG is comparable to that of the online RTS
(Realtime Strategy) game called Warcraft
III [12]. Indeed, the pace of gaming in MMORPGs
and RTS games is similar, while the pace of FPS games is much
faster.
Figure 4: Packet load distribution
Figure 5: Bandwidth distribution
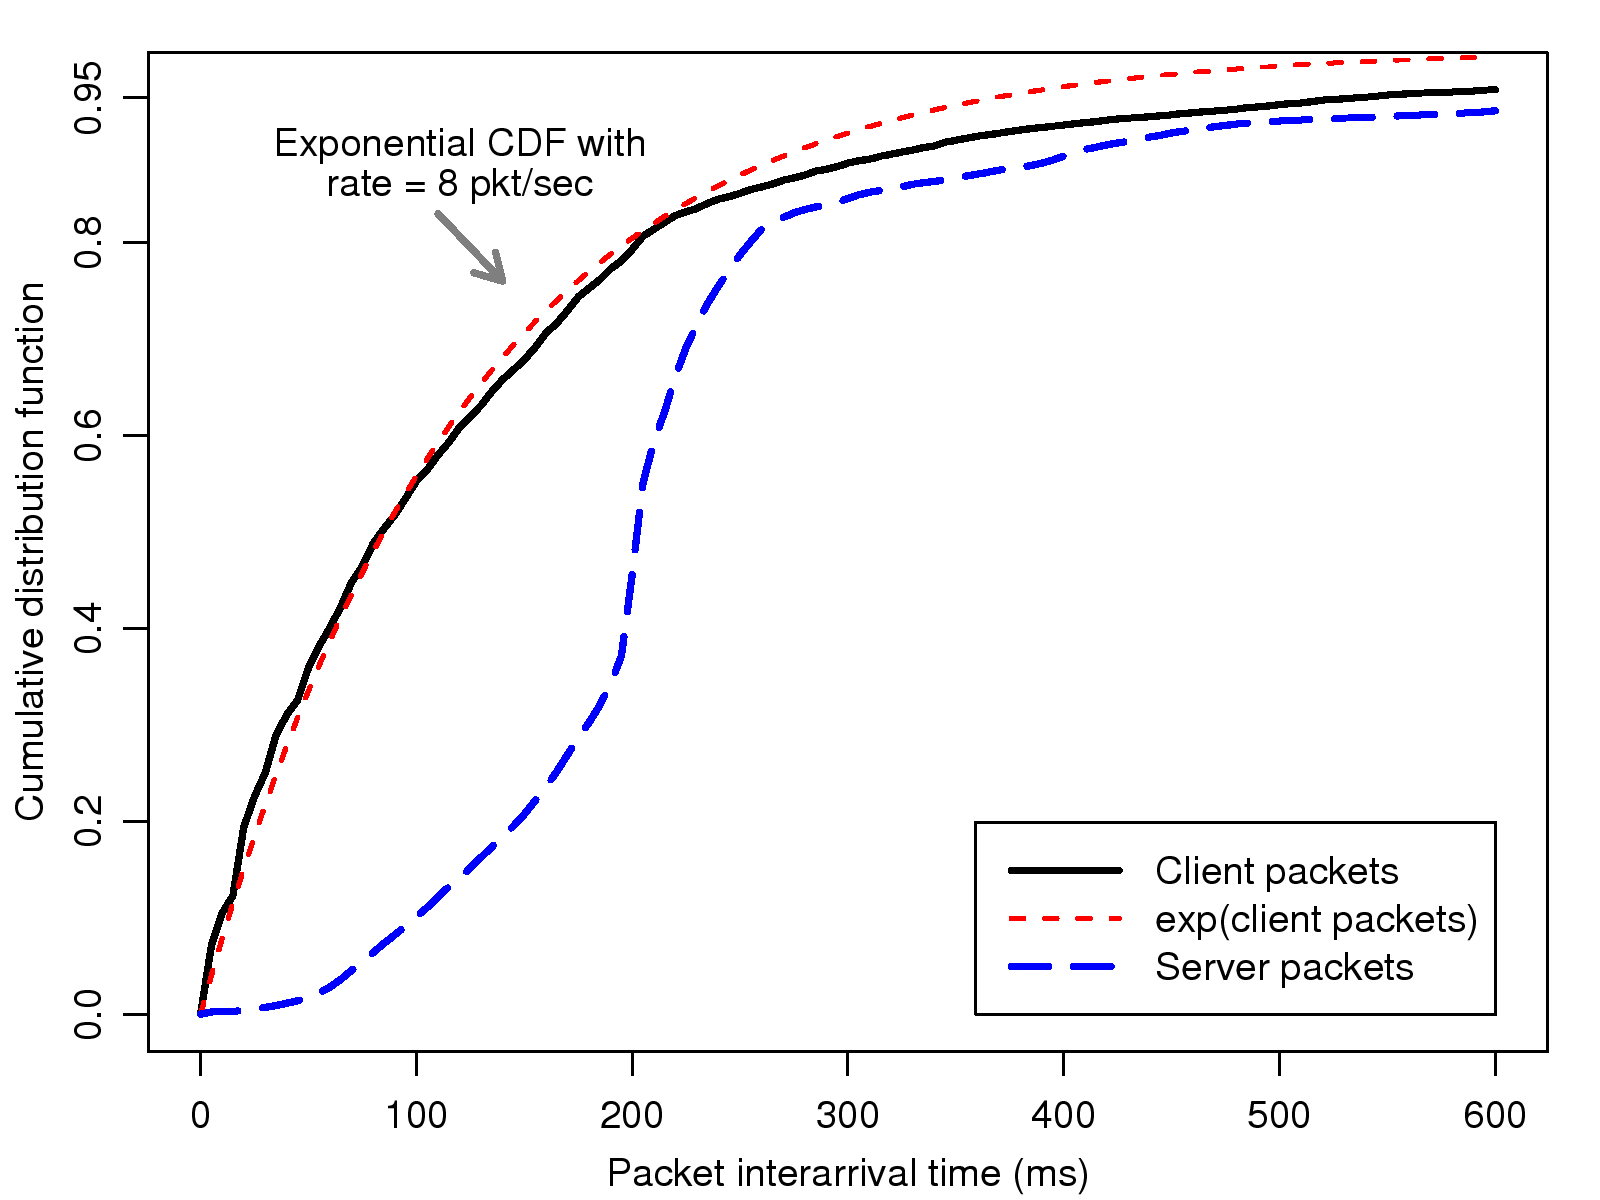
4.3 Distribution of Packet Interarrival Times
In order to understand traffic dynamics within individual
connections, we first observe the distribution of inter-packet times
for client data packets. As Fig. 6 shows, most
packet interarrival times are spread over 0 ms to 600 ms. We
find that the best-fit exponential distribution with a rate of 8
pkt/sec approximately fits the empirical cumulative distribution
function; however, the deviation of the exponential-fit is apparent
at time scales larger than 200 ms. Further investigation shows
that the deviation from the exponential distribution of inter-packet
times is caused by the diversity of user behavior, which is a
distinct feature of adventure-oriented games, especially MMORPGs.
For game genres like FPS, RTS, and FTG (Fighting Games), during a
game, players must be active continuously, or they will be defeated.
Such games are usually round-based so that players are forced to be
idle if they are defeated, but they can be active again in the next
round. In contrast, MMORPGs and other adventure-oriented games
do not require participants to "play" all the time. During
a game, players can do anything at will: they can carefully inspect
their equipment; wait somewhere for friends or some event; or simply
leave their characters idle, unless the characters are on the
battlefield. We found that most players were idle, at least for a
while, during the trace period, and some were even idle most of the
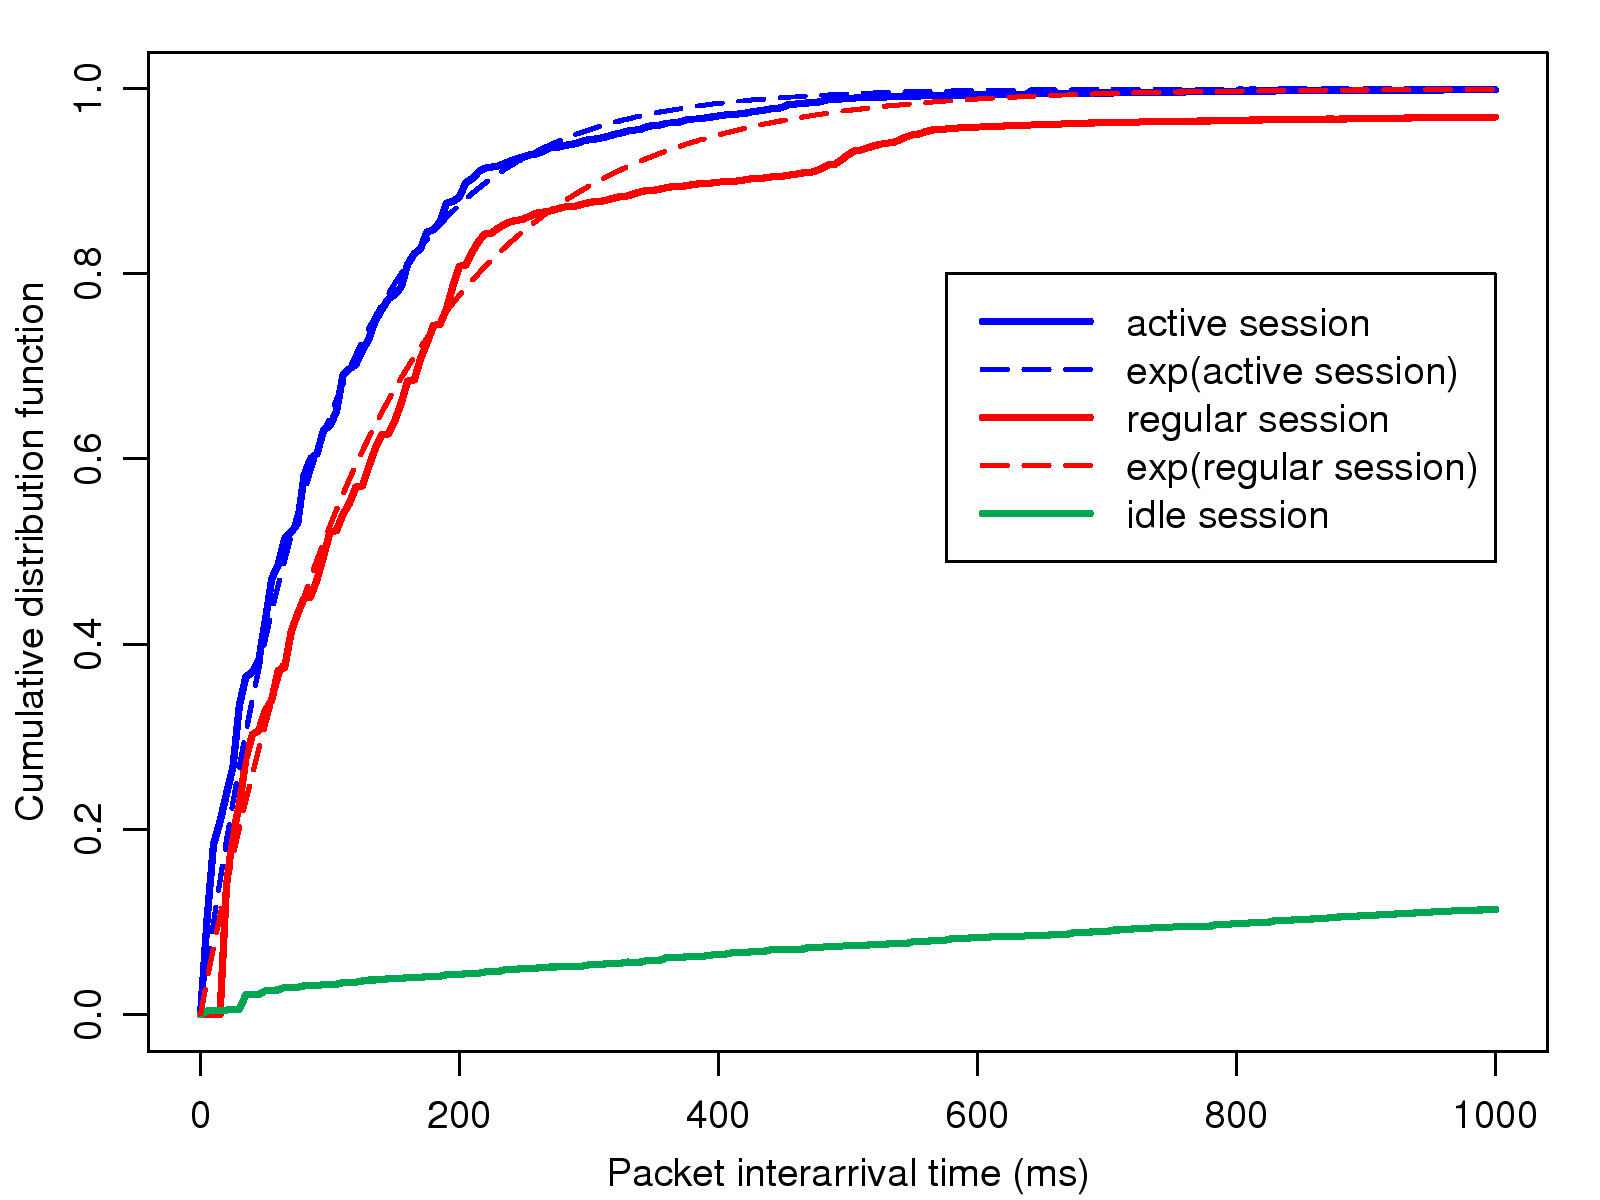
time. To demonstrate, we picked three representative connections
from the traces, namely, active sessions (almost no idle time), idle
sessions (almost always idle), and regular sessions. The
distributions of packet interarrival times of these sessions are
shown in Fig. 7. We observe that the
distribution of the active session is nearly exponential,
while that of the idle session is far from exponential. Actually,
the latter is a hybrid of a uniform distribution and a deterministic
distribution, where the determination derives from the 5-second
interval of the keep-alive timers. Naturally, the inter-packet time
distribution of the regular session is between the above two
extremes. This explains the distribution in
Fig. 6, which is close to exponential in small
time scales, but has a longer tail, since it comprises inter-packet
times from sessions with various degrees of activity. Furthermore,
the diversity of user behavior makes it difficult, if not
impossible, to define a typical player so that modeling user
behavior and source traffic in MMORPGs is especially challenging.
On the other hand, server packet interarrivals are much more
regular-approximately 50% of the interarrival times are around
200 ms. The concentration of inter-packet times at certain
intervals shows that server processing is round-based, i.e.,
servers broadcast information to clients on a regular basis. We
investigate the periodicity of game traffic further in
Section 5.2.
Figure 6: Packet interarrival distribution
Figure 7: Client packet interarrival distributions
for representative sessions
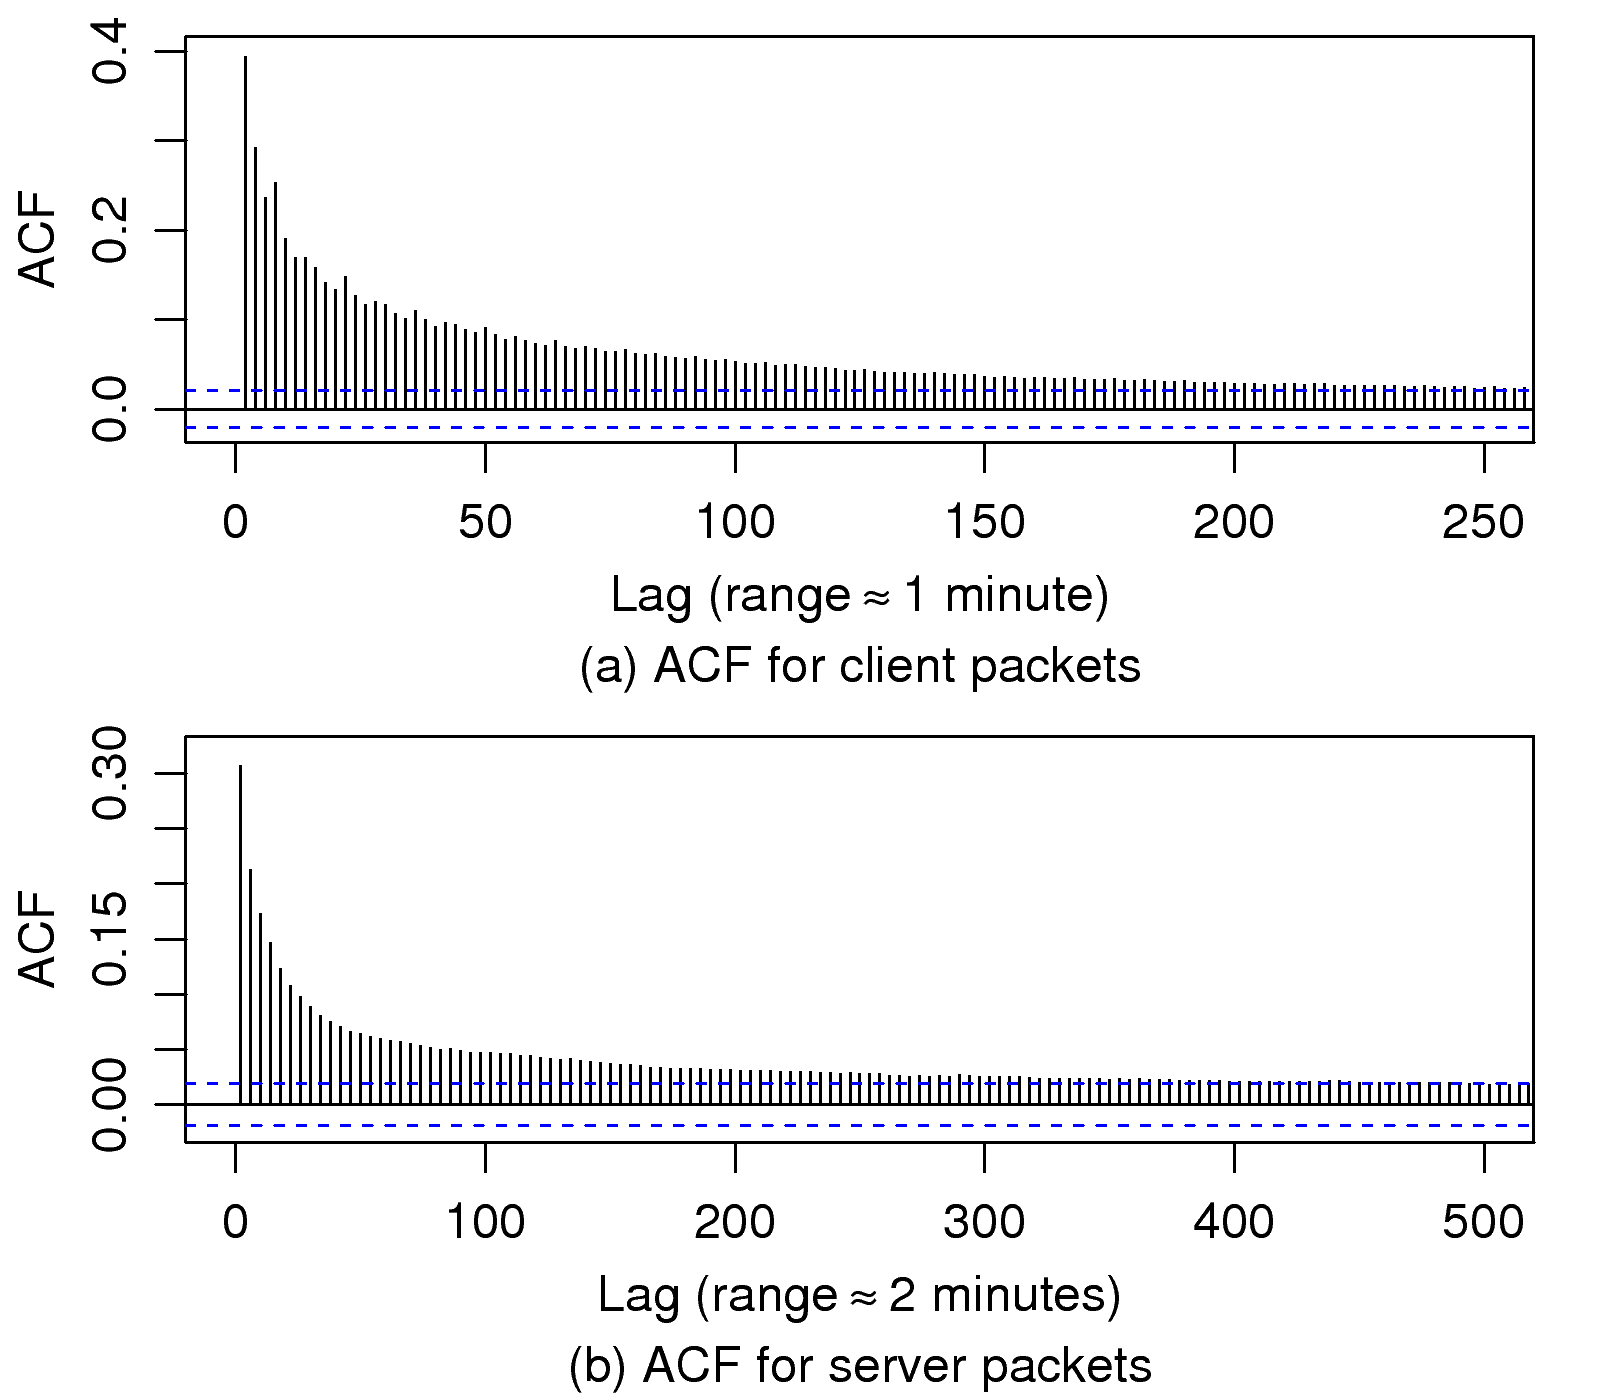
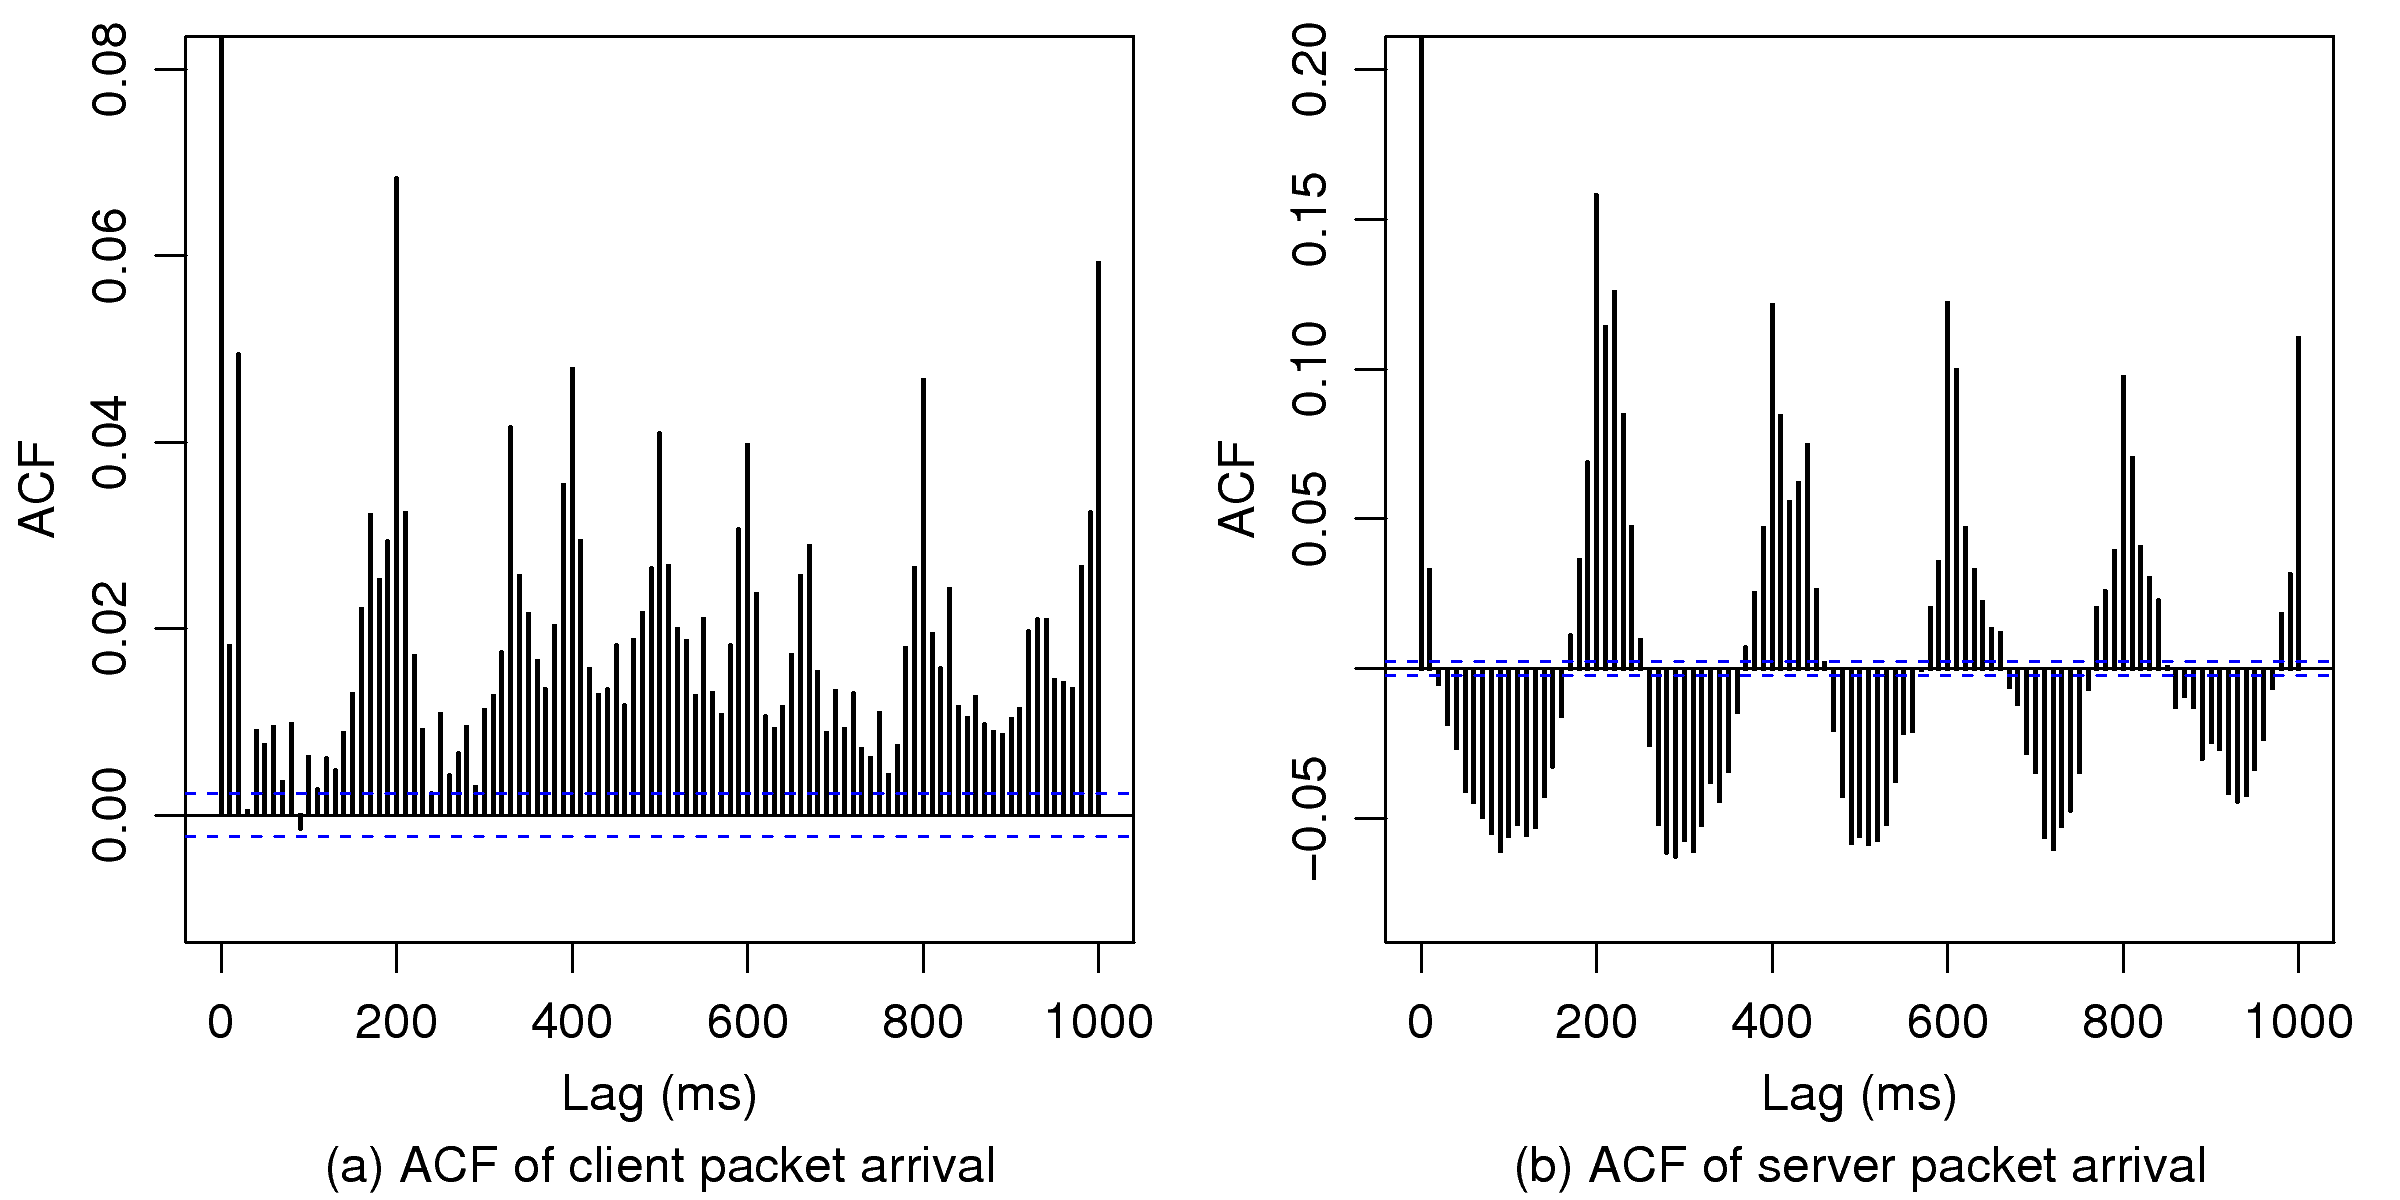
4.4 Temporal Dependence of Packet Interarrivals
As the interarrival times of data packets sent by game clients are
close to exponential, at least for active sessions, one may wonder
if player commands conform to Poisson arrivals. An initial check via
the auto-correlation functions (ACF), shown in
Fig. 8, indicates that packet interarrivals
in both directions exhibit positive temporal dependence.
Thus, the hypothesis of Poisson input is rejected.
In Fig. 8(a), client packet interarrival
times show positive auto-correlations up to one minute. We believe
this phenomenon is attributable to the clustering nature of
player actions; that is, commands issued by players are often
successive and made in bursts. For example, common behavior of a
character in a game includes walking, chatting, resting, fighting,
examining loot, trading, and so forth. Whatever the type of action,
it is likely to last for a period of tens of seconds. Furthermore,
traffic sent by a game client is decided by the type of current
action. For example, when a player is talking with other players,
examining equipment, or conducting a business transaction, the
client sends very little traffic. In contrast, fighting and movement
actions result in bursts of commands, which generate bursts of
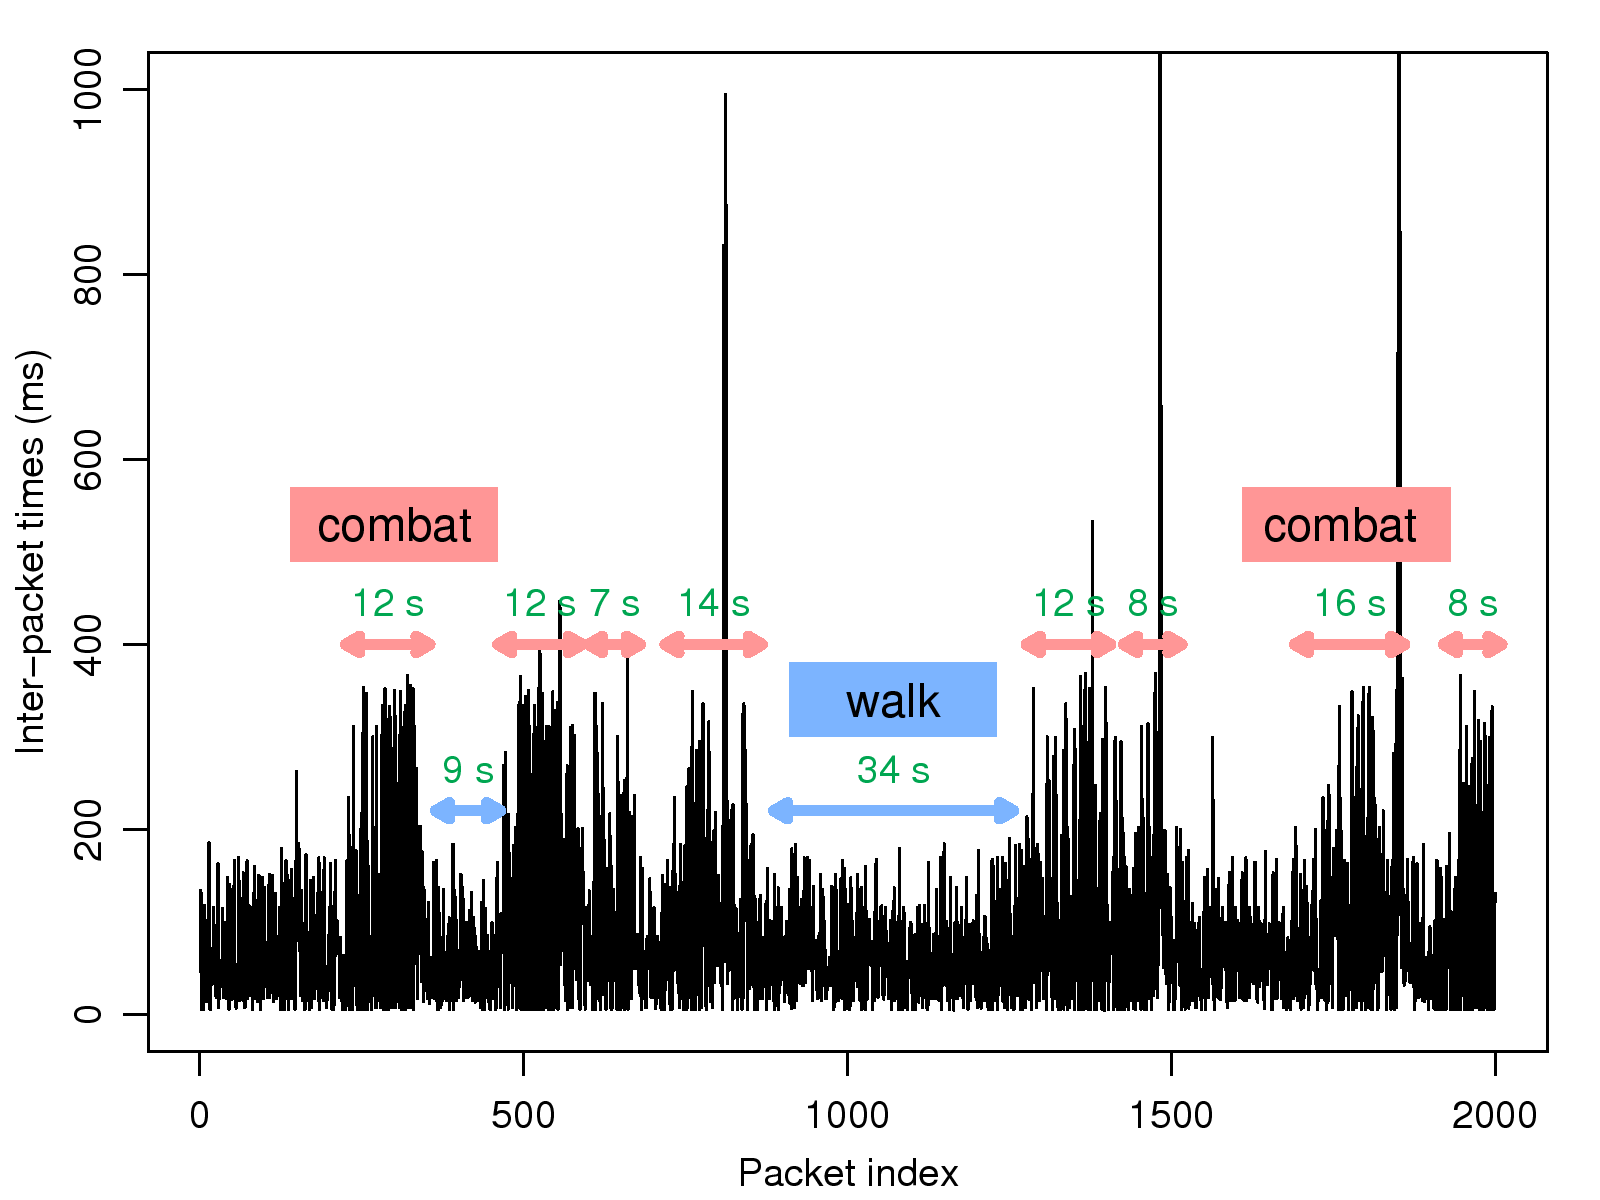
client packets. To demonstrate, 2,000 successive inter-packet
times drawn from a randomly selected session are depicted in
Fig. 9. We observe that the inter-packet times
of similar intervals are clustered, where clusters of
approximately 333 ms (1/3 second) are identified as fighting
actions, i.e., each command corresponds to a strike action.
Similarly, clusters of approximately 167 ms (1/6 second) are
identified as movement actions, i.e., each command moves the
character one step further. Since player actions exhibit the
above-mentioned temporal locality and the rate of client
packets depends on the type of current action, positive
auto-correlations (up to one minute) are formed in client traffic,
as shown in Fig. 8(a).
In contrast, server packet interarrivals exhibit positive
auto-correlations up to two minutes. We explain the phenomenon by
the following observations. First, server packets primarily convey
the position and state updates of characters, including the player
character (the character controlled by the player himself), nearby
characters played by other gamers, and non-player characters (NPC)
controlled by the game logic. We use "neighbors" to denote
characters around the player character, no matter if they are NPCs
or belong to other gamers. Based on our observations in
Section 4.3, we find that servers notify
each client about the most up-to-date positions of his neighbors on
a per-round basis. More specifically, according to the developers of
ShenZhou Online, servers send out position updates in each round, unless no
other characters are around, or no neighbors have moved since the
last position update was sent. In other words, the position of each
neighbor is only included in the server update message if it has
changed since the last update. This design suggests that the
rate of position updates would be roughly proportional to the number
of neighbors if the movements of each character's neighbors do not
follow any particular pattern. We confirm this conjecture by a
separate experiment conducted at the client side. In the experiment,
we compute the average rate of server data packets received by the
game client for different scenarios in which varying densities of
neighbors are around the the player character. Each scenario lasted
for 30 minutes. The average server data packet rates we observed
were 2.8, 6.2, and 10.8 pkt/sec when the character was in a
quiet place, a unpopular intersection, and a crowded market,
respectively. The above conjecture is therefore confirmed by the
approximate proportionality between the server packet rate and
neighbor density.
Second, because the game map is continuous and characters are widely
spread over the map, the number of neighbors across the map has the
property of spatial locality. That is, two characters that
are geographically close to each other have a similar number of
neighbors. Furthermore, when a character moves across the map
continuously, the spatial locality of the number of neighbors will
be transformed to the temporal locality of the number
of neighbors, i.e., the time series formed by the number of
neighbors sampled in each round is auto-correlated. An exception to
spatial continuity (and therefore temporal locality) is that a
character can "teleport" to another place instantly by a scroll or
magic; however, compared with walking actions, this feature is not
used frequently.
In summary, we observe that 1) the number of neighbors possesses
temporal locality; 2) the rate of position updates is roughly
proportional to the number of neighbors; and 3) server packets
primarily convey position updates. As a consequence of the above
interrelation between server mechanisms and user behavior, temporal
dependence up to two minutes is formed in server packet
interarrivals, as shown by the the auto-correlation function in
Fig. 8(b),
Figure 8: Correlograms of within-connection packet interarrivals
Figure 9: The clustering nature of player actions
4.5 Peak Rate and Burstiness
In Section 4.2, we noted that the "average" packet load
of each connection is not high; however, in terms of network
performance, the "instantaneous" rate is more relevant. Although
we cannot actually obtain an instantaneous rate of a measured
traffic process, we can approximate it by computing the peak rate at
a certain (usually small) time scale. Unlike the average rate, the
peak rate can provide information about how much bandwidth a
connection would need in the most demanding cases.
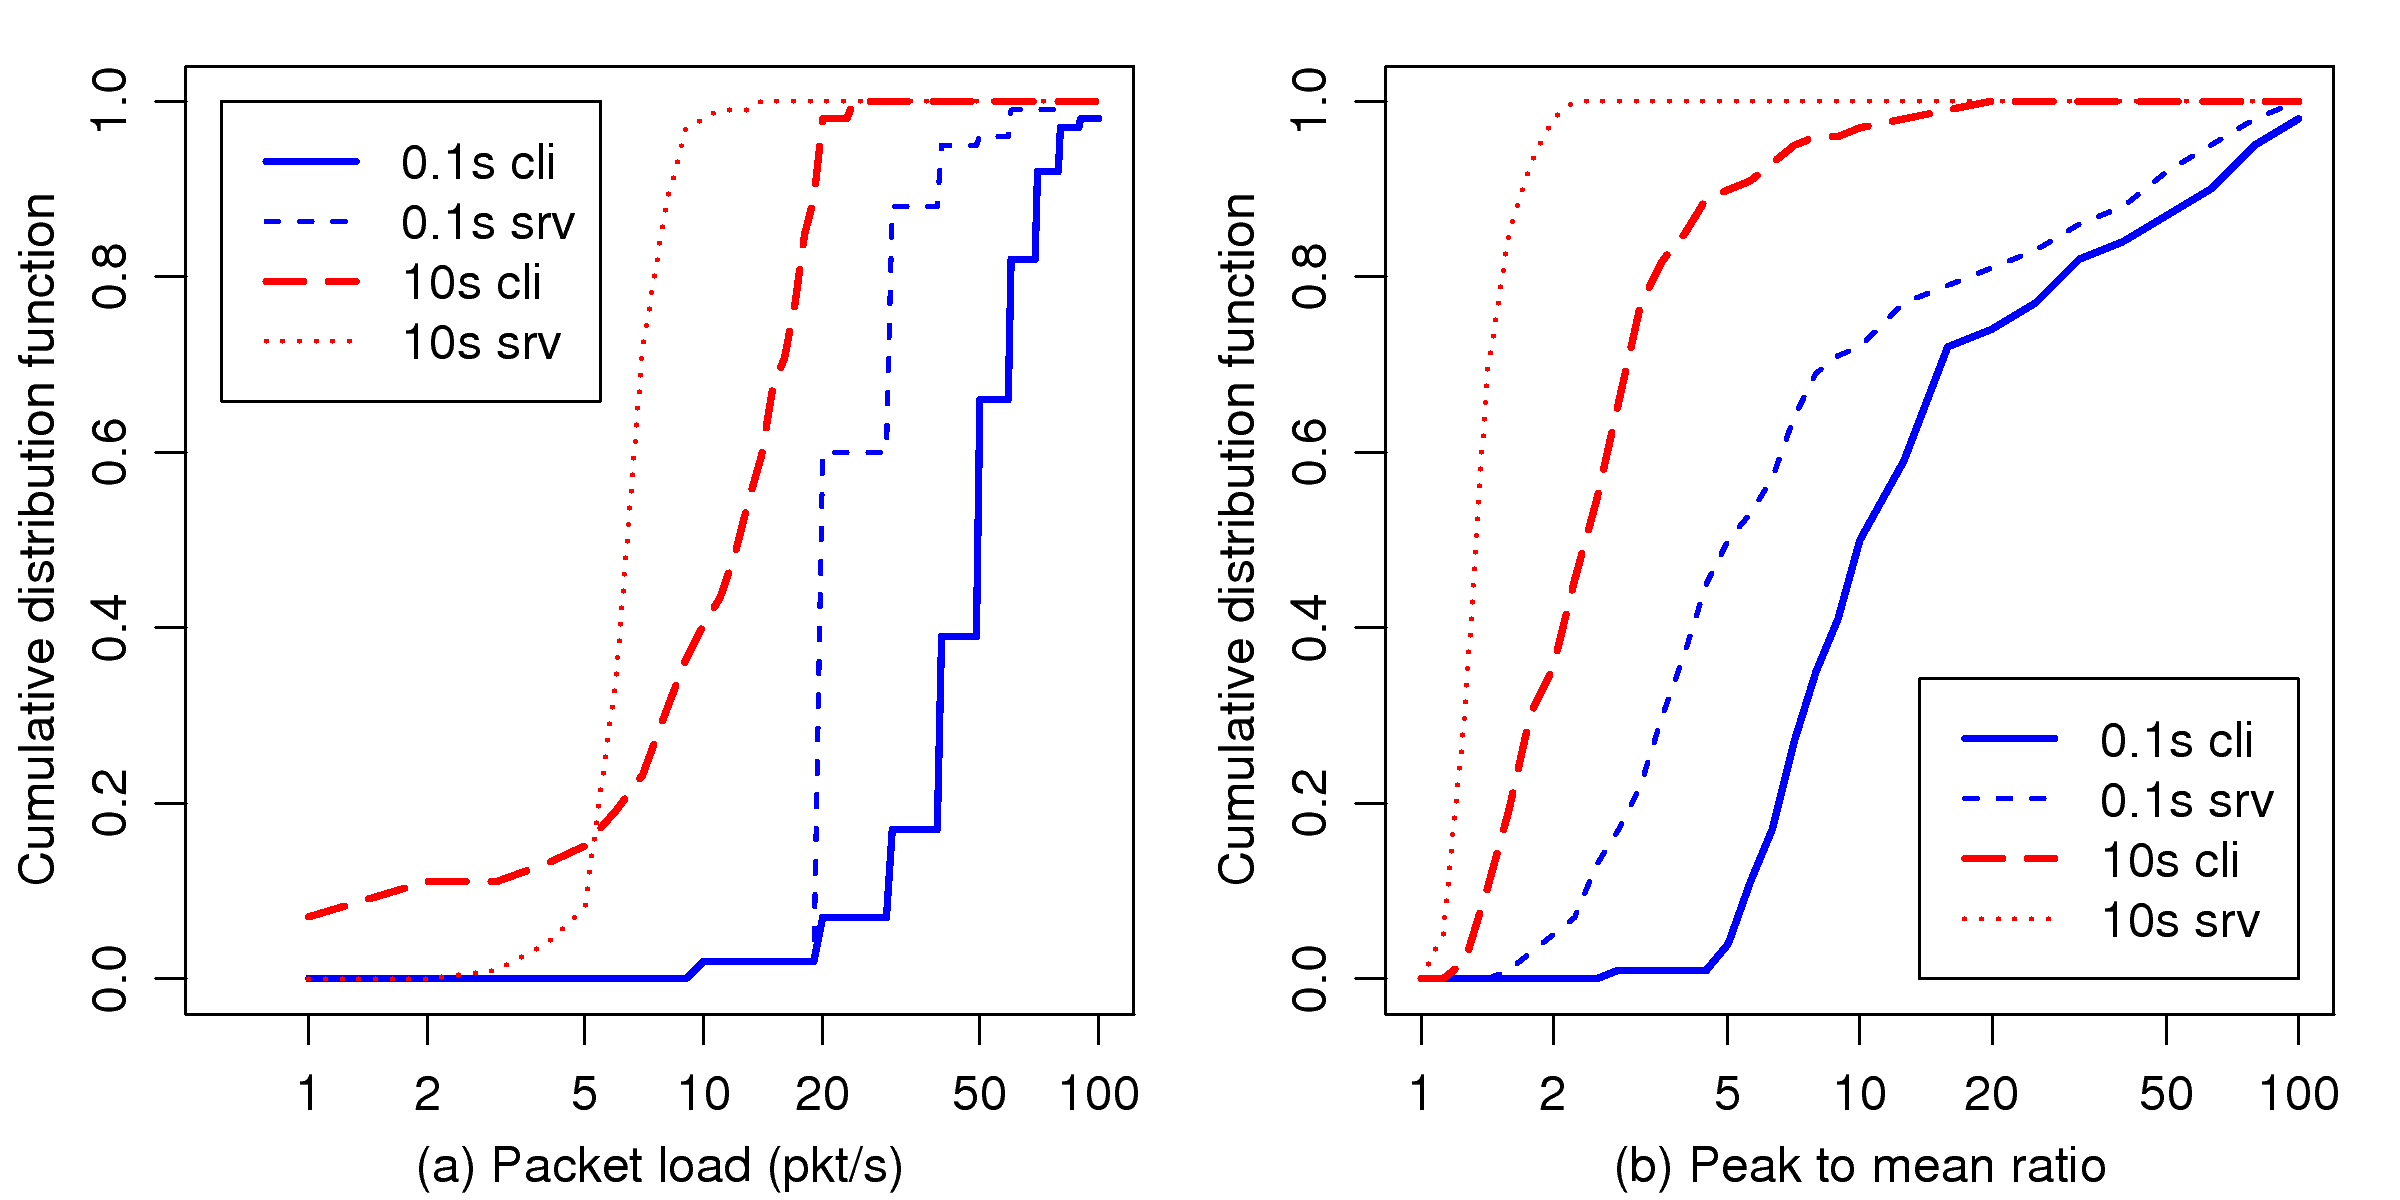
In Fig. 10(a), we plot the distribution of the peak
packet load measured at two time scales, 0.1 second and 10
seconds, for client traffic and server traffic, respectively. We can
see that the peak rate of client traffic is generally higher than
that of server traffic. For most connections, the peak rate is
within 5-7 packets for client traffic and within 2-3
packets for server traffic within 0.1 second. Compared with the
average rate of less than 0.5 packets per 0.1 second for traffic
in both directions, this measure shows that the release of packets
is not smooth over sub-second time scales. At the same time, game
clients may send out 200 packets within 10 seconds, compared
with the average of 45 packets for the same period. This measure
shows that the variability of traffic remains in intervals of 10
seconds. On the other hand, the maximum number of packets sent by
game servers within 10 seconds is exactly 50 for most
connections, which again supports the observation on the regularity
of server traffic in Section 4.3.
Figure 10: Peak packet load and peak to mean ratio of packet
load observed in different time scales
In Section 4.4, we observed that both client
traffic and server traffic tend to be temporally clustered. This
temporal dependence in inter-packet times definitely makes traffic
less smooth, i.e., more bursty. To understand traffic
burstiness, i.e., the variability of packet counts observed in
successive periods, of game traffic, we compute the peak-to-mean
ratio, which is defined as the ratio of the peak packet rate versus
the average packet rate at a certain time scale for each connection.
The distributions of the peak-to-mean ratio for individual
connections are shown in Fig. 10(b). We find that
the peak-to-mean ratio of traffic in either direction can be at most
100:1 at 0.1 second; however, on average, it is 14:1 and
5:1 for client traffic and server traffic, respectively. At 10
seconds, the peak-to-mean ratio is reduced to an average of
2.5:1 for client traffic, and 1.4:1 for server traffic.
Nevertheless, we cannot determine whether game traffic is "bursty"
simply by the magnitude of the peak-to-mean ratio, as "how bursty
is bursty?" is not a trivial problem.
In the following, we seek to answer the question by comparing game
traffic with traffic in two other applications: TELNET and FTPDATA.
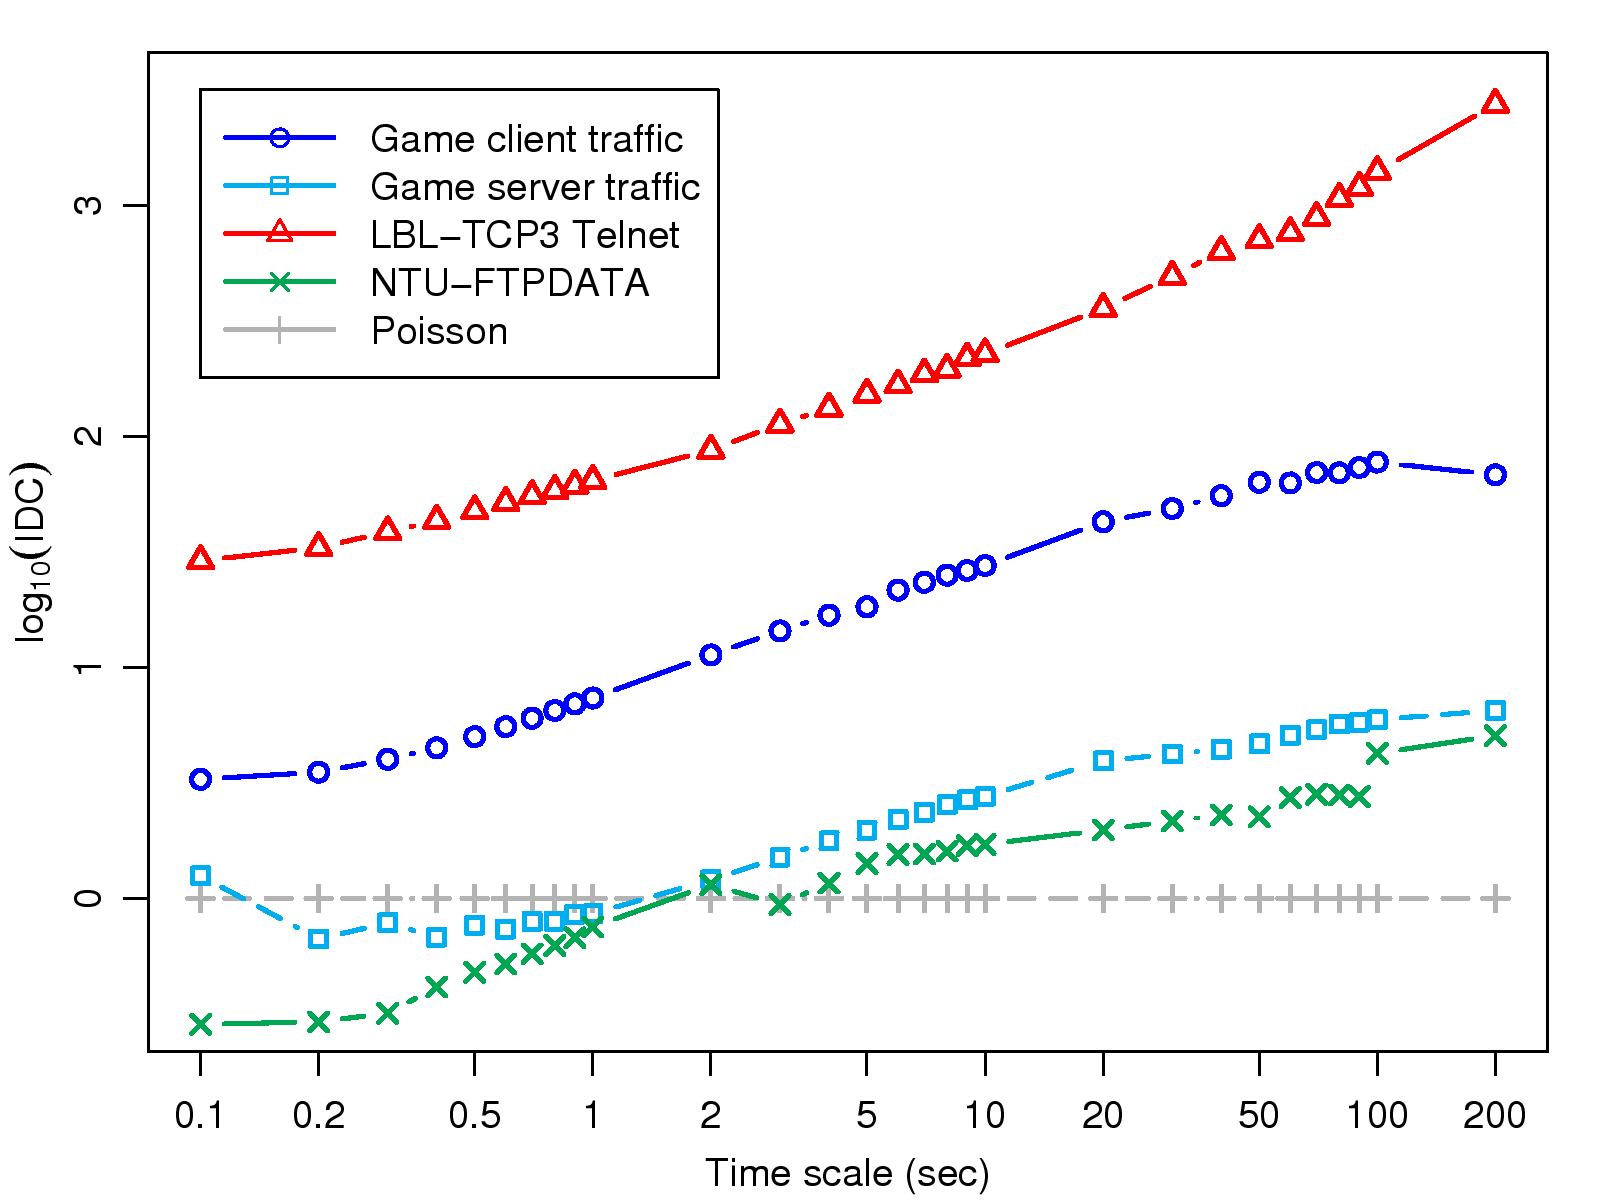
Unlike the peak-to-mean ratio, the index of dispersion for counts
(IDC), which is also an indicator of traffic burstiness, is defined
over various time scales. The IDC at time scale t is defined as
the variance in the number of arrivals in an interval of time t
divided by the mean number of arrivals in t [13], that
is,
It =
Var
(Nt)
E(Nt)
,
where Nt indicates the number of arrivals in an interval of time
t. The IDC is thus defined so that, for a Poisson process, the
value of the IDC is 1 for all t. We compare the game traffic
burstiness to that of TELNET and FTPDATA for several reasons. First,
both applications tend to have long-term connections, i.e., the
duration is in the scale of minutes or hours, which is usually the
case with network games. This explains why we do not include HTTP in
the comparison, as most HTTP transactions are extremely short.
Second, despite the graphical user interface, client/server network
games are very similar to TELNET applications in terms of
interactivity and the command-response pattern, where a server
responds to client commands by sending back the latest status
maintained by the server. Third, though bulk data transfer, i.e.,
FTPDATA, is very different to the behavior of network games, it can
act as a reference because its traffic burstiness arises primarily
from the communication protocol, TCP, and the network. That is,
unlike network games, where the timing of data packets released into
network is reasonably close to the timing of data packets being
generated, the timing of FTPDATA packets is dominated by TCP's
congestion control mechanisms and the conditions of the network
path, such as the round-trip time, hop distance, level of
congestion, and cross-traffic.
The TELNET source traffic we use is the LBL-TCP3 trace from
the Internet Traffic Archive [14], which is a 2-hour packet
trace containing 322 TELNET sessions. Because no FTP traces with
sufficient volume are available in the Internet Traffic Archive, we
conducted a 4-hour measurement on the gateway router at
ee.ntu.edu.tw. The measurement captured only FTPDATA (TCP
port 20) packets, and yielded a total of 5.3 million packets and
156 FTPDATA sessions. To avoid being misled by intra-campus file
transfers, which usually produce smoother traffic (since congestion
is less likely to occur along the path), we removed intra-campus
sessions. This left 4.2 million packets and 132 sessions.
Hereafter, we call this trace NTU-FTPDATA. Since we are
concerned with traffic burstiness of individual TCP
connections, we first compute the IDC of each connection, and then
compute the average IDC for each application by taking the geometric
mean of IDC magnitudes at the same time scales. The reason for using
the geometric mean instead of the commonly used arithmetic mean is
that the IDCs are actually ratios (variance versus expected value).
Taking an arithmetic mean of ratios with different bases could be
misleading; hence, the geometric mean is recommended for such
cases [15].
Fig. 11 shows the averaged IDC measures of
game traffic in both directions, TELNET source traffic, and FTPDATA
source traffic. We also provide the IDC of a Poisson process for
comparison. Note that, before computing the IDC, all traffic
processes were normalized to the same mean rate to obtain comparable
IDC ordinates. Intuitively, the traffic sent by game clients should
have similar burstiness to TELNET source traffic; however, in
Fig. 11, we find that TELNET traffic is
much more bursty than game traffic in both directions. We believe
this discrepancy is due to the following reasons. First, human
typing speeds can be extremely fast, say, 5-10 keystrokes per
second, which is much faster than the number of mouse clicks players
can make during the same interval. Second, some built-in automatic
steering mechanisms (see Section 5.2) in game clients,
such as auto-walk and auto-attack, induce a certain regularity into
client traffic, thereby reducing the burstiness of the traffic.
Third, keep-alive messages, which are sent every 5 seconds, cut
off the possible heavy tail of game packet interarrival times. In
contrast, TELNET packet interarrivals have been shown to be
heavy-tailed, which increases the burstiness of packet arrival
processes [16].
Game server traffic, by comparison, is much less bursty than game
client traffic. In particular, the burstiness of server traffic is
lower than that of a Poisson process at small time scales ( < 2
seconds), which is the consequence of periodic position updates.
Except for the low burstiness at small time scales, the burstiness
of server traffic gradually increases in higher time scales as
client traffic becomes more bursty. We believe this behavior is due
to the fact that part of the server traffic is actually a
response to client commands; therefore, its variability is
affected by client traffic and becomes more bursty as the latter
becomes more bursty at large time scales. Not surprisingly, FTPDATA
connections have relatively lower traffic burstiness. The reason is
that FTP applications transmit a full window of packets in each
round-trip time whenever possible, which leads to strong periodicity
at the time scale approximately equal to the round-trip time. With
stable network conditions, the primary factor in traffic
fluctuations is TCP's congestion control, i.e., the increase and
decrease of the congestion window. Consequently, FTPDATA traffic
exhibits relatively lower burstiness, provided that the network
conditions of most connections in NTU-FTPDATA are stable.
Figure 11: The traffic burstiness comparison of game
traffic, TELNET traffic, and FTPDATA traffic
5 Aggregate Traffic Characteristics
We now seek to identify traffic patterns in the aggregate arrival
processes of data packets, especially whether within-connection
patterns continue to exist and how they change due to flow
multiplexing. We first identify the temporal dependence in aggregate
traffic and derive a flash-crowd event caused by global events.
Next, we identify the periodicity and synchronization rooted in the
system's design and show that this degrades network performance.
Lastly, we show the self-similarity in game traffic in both
directions, and provide physical explanations based on player
activities.
To obtain aggregate packet arrivals, we count the number of packets
in every 10 ms for both inbound and outbound traffic. As
auto-correlation functions and spectrum are defined on a
(second-order) stationary process, we ensure the stationarity of the
packet counting time series by sub-sampling. That is, we first
select a subset of connections that span a complete two-hour period,
and count the packets corresponding to the selected connections
during that period.
5.1 The Flash Crowd Effect
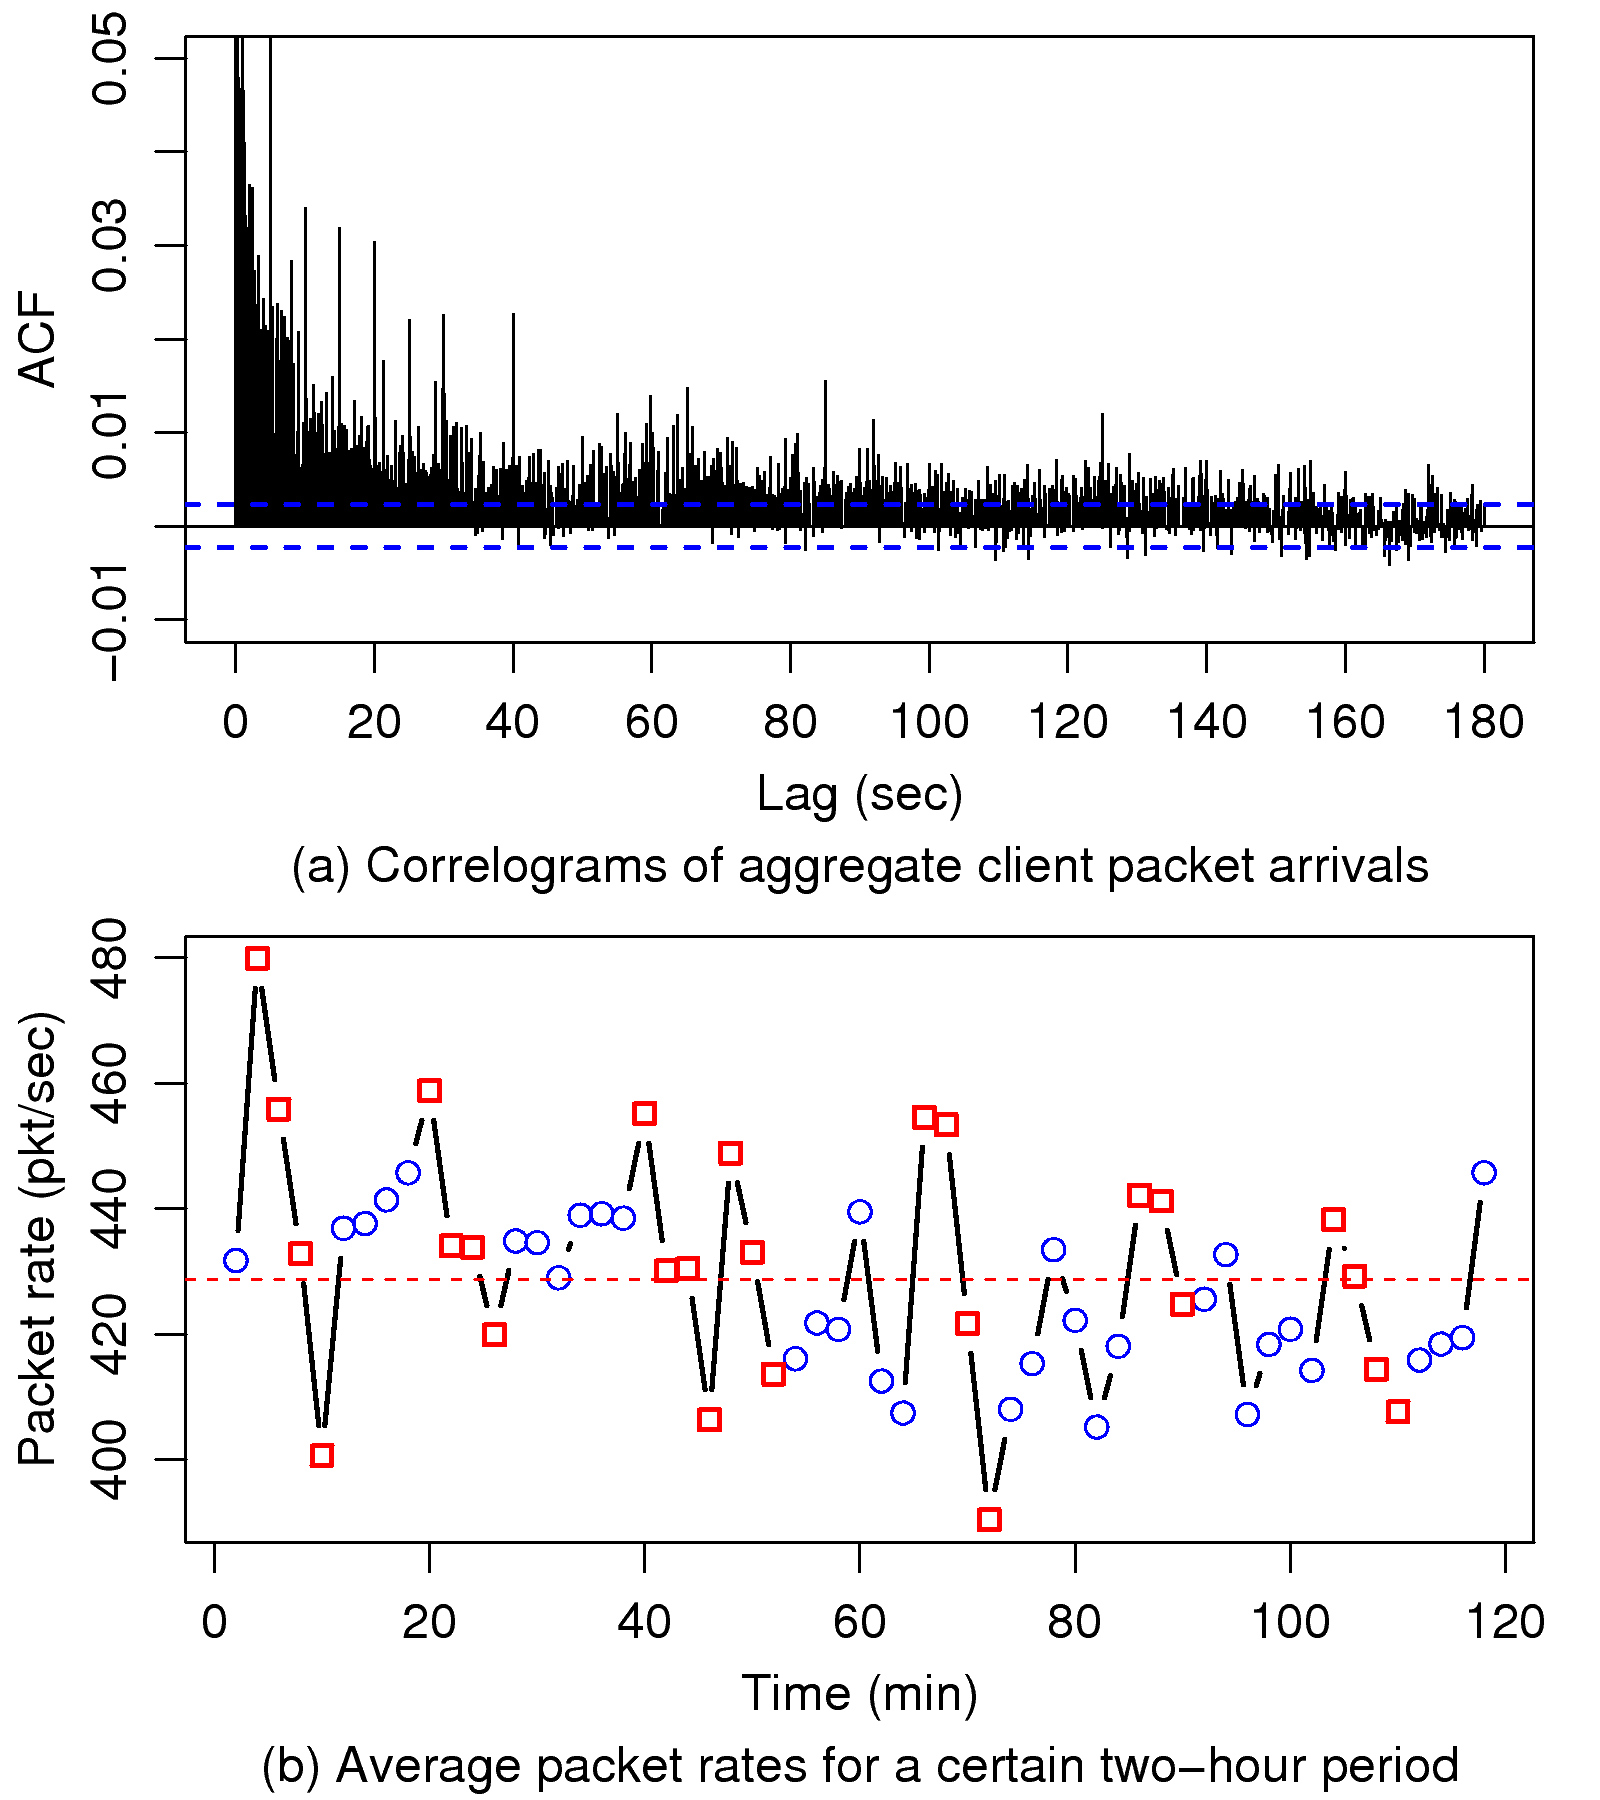
To understand the patterns in aggregate client traffic, we examine
the temporal dependence of aggregate client packet arrivals by
correlograms, as shown in Fig. 12(a). From
the figure, we can see that client packet arrivals exhibit sustained
positive auto-correlations in lags longer than three minutes.
Although we have already seen a similar effect in within-connection
packet interarrivals in Section 4.4, the
aggregate traffic exhibits positive auto-correlations of a longer
range (3 minutes versus 1 minute). While the temporal dependence
within individual connections arises from the clustering nature of
players' actions, temporal dependence in aggregate packet arrivals
initially seems counter-intuitive. In other words, it is
unreasonable that a considerable proportion of players act or idle
synchronously. Based on a detailed analysis, we find that the design
of global events, i.e., random events held by the system, is
one possible cause of the phenomenon. A global event can be seen
as a special type of "quest" that encourages players to actively
join a short-term activity and rewards the participants with
experience points.
When such events occur, players near the scene could join forces to
eliminate the monsters. Global events are held every 10 or 20
minutes. An event is finished once the assigned objective has been
achieved, which usually takes several minutes. Since a number of
players fight in global events and return to their own journeys
afterwards, the events can cause flash crowd effects.
To demonstrate the impact of global events, in
Fig. 12(b), we depict the average packet
rates sampled every two minutes in a two-hour interval. We can see
that peaks always occur around multiples of 10 minutes, and
therefore confirm the effect of global events which are held every
10 or 20 minutes. We also observe that a dip occurs following
each peak with a distance of 2-3 samples (corresponding to
4-6 minutes), which may indicate the time that elapses until
each global event quietens down. The effects of global events
undoubtedly lead to positive temporal dependence in user activities,
and therefore locality in client packet arrivals. Though global
events do not take place continuously, due to their significance and
frequency, they affect the overall temporal dependence of client
traffic to some extent. On the other hand, we consider the
heavy-tailed ON/OFF-periods of players activities as another cause
of the large-scale correlations in game traffic. We discuss this
point in Section 5.3.
Figure 12: The temporal locality in aggregate client
traffic and its explanation. Figure (b) plots the average packet
rates sampled every two minutes for a period of two hours. Peaks,
valleys, and their in-between samples, which are considered to be
the effects of global events, are marked by
squares.
5.2 Periodicity
Taking a closer look at Fig. 12(b), i.e.,
focusing on the auto-correlation function over time lags shorter
than one second, we get the result shown in
Fig. 13(a). According to the graph, we find that
some form of periodicity exists in client packet arrivals in that
higher correlation coefficients occur at lags equal to multiples of
200 ms. However, it is hard to tell whether periodicity actually
exists by visually checking the auto-correlation functions, so we
employ a frequency domain method to examine the periodicity in
client traffic. In contrast to client traffic, server traffic is
apparently periodic with a cycle of 200 ms, as shown in
Fig. 13(b). This implies the round-based position
updates are synchronous for all game clients.
Figure 13: Correlograms of aggregate packet
arrivals
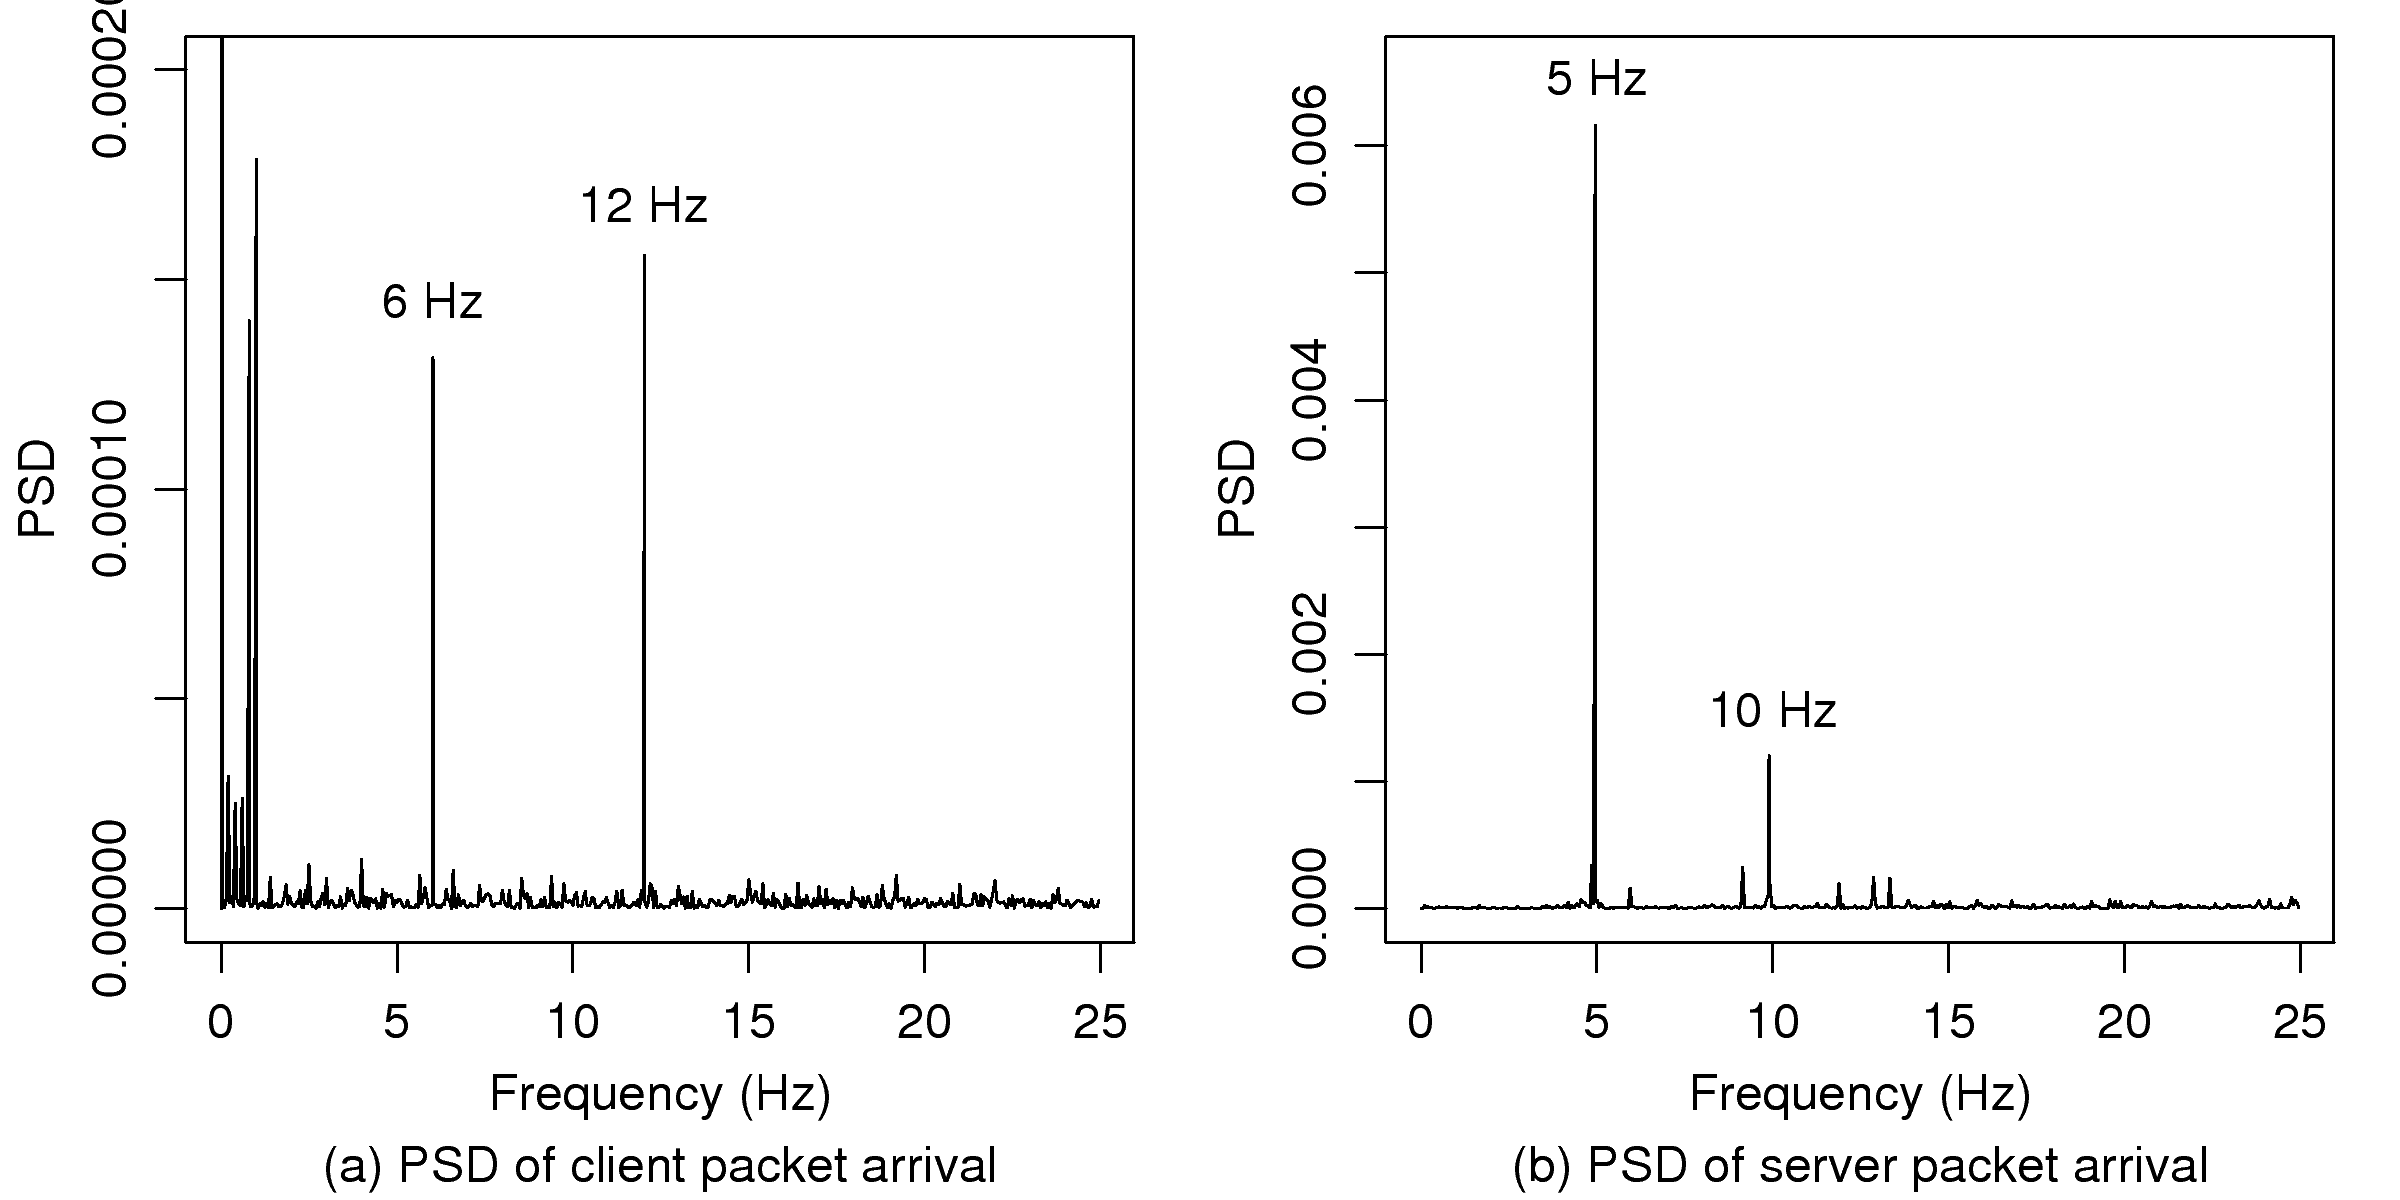
Power spectral density (PSD) is a more direct way to analyze the
frequency components in time series. Fig. 14
indicates strong periodicity in traffic in both directions, i.e.,
multiples of 5 Hz in server traffic and multiples of 6 Hz in
client traffic.
According to the graph, server traffic is more regular than client
traffic, as less spikes occur in Fig. 14(b). This
is not only because server traffic is more periodic, but also
because we obtained the packet trace at the server side; therefore,
the client packets were time-stamped after they had travelled over
the network, but the server packets were not.
Figure 14: Power spectral density of aggregate packet
arrivals
The identified frequency of 5 Hz of server traffic clearly echoes
the large proportion of 200 ms server packet interarrival times
identified in Fig. 6. We found that frequencies
with multiples of 5 Hz also exist, as servers adjust the frequency
of position updates based on certain factors, such as the density of
neighbors. At the same time, we found that the multiples of 6 Hz
frequency components in client traffic are due to
automatically generated commands. Specifically, a player can
switch to an "auto-movement" mode by clicking the left mouse
button for two seconds, and the character will continuously move
toward the mouse cursor until it is switched back to normal mode.
Attack actions can also be performed automatically by entering the
"auto-attack" mode. In the client's implementation, a timer of
corresponding frequency is used to issue movement or attack commands
in place of the player, where the frequency is decided by the level
and skill of the character, and the weapons it holds. The
periodicity should be cancelled out if the clients' timers are not
synchronized; however, it still exists. From a discussion with ShenZhou Online developers, we found that the synchronization of clients' timers is
because their initialization is based on the arrival of server
packets, which are sent in a burst to all clients. Although this was
not the developers' original intention, the design choice ensures
that game clients act in a synchronized manner.
The strong frequency components in server traffic imply that a large
proportion of server packets are sent in bursts periodically.
We believe that bursts of server packets (primarily position
updates) are unnecessary and can lead to performance problems. Our
conjecture is that server packets sent periodically have a
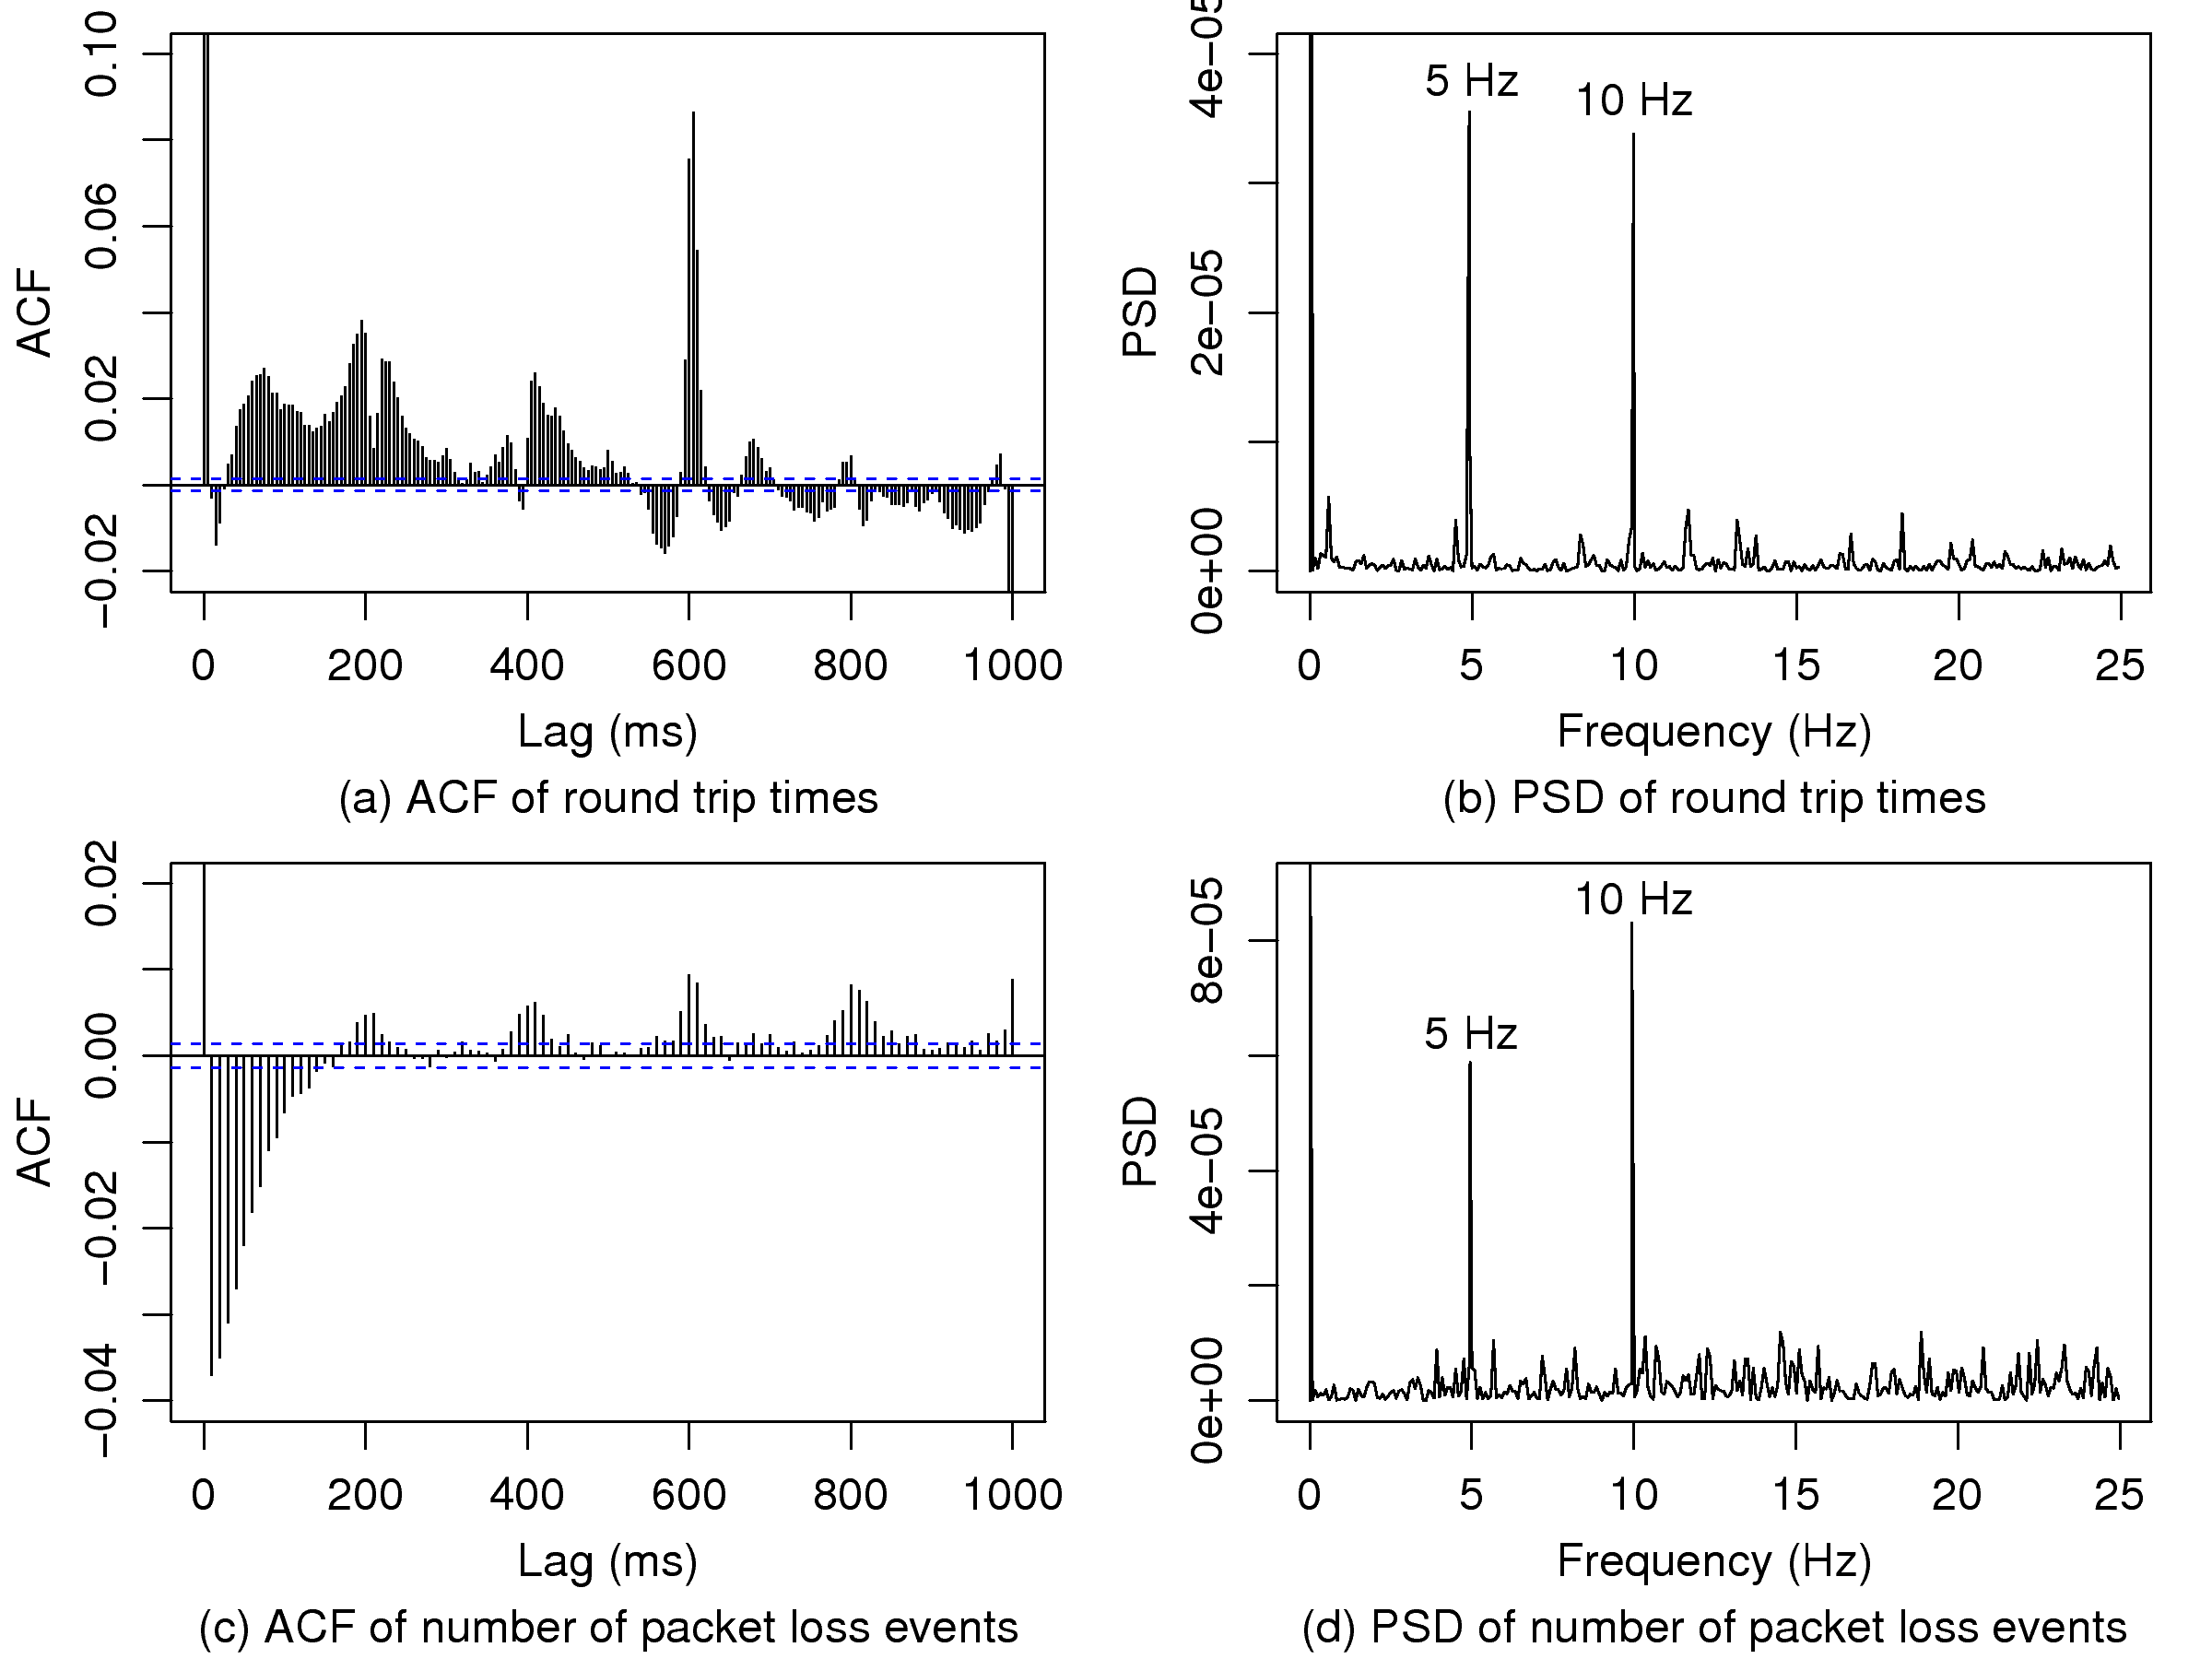
higher probability of being dropped. To verify this hypothesis, we
estimate the round-trip times (RTT) and packet loss events in the
traces. As the trace was taken at the server side, a round-trip time
is defined as "the time that elapses before a server data packet is
acknowledged by an acknowledgement packet sent back from the
client." Packet loss events are inferred by packet retransmissions,
where a server data packet is considered lost if an identical packet
(at the TCP level) is re-transmitted. We first examine whether any
pattern exists in the round-trip times by the correlogram and power
spectrum. As shown in Fig. 15(a)(b), the
auto-correlation function estimated from the RTT process shows that
high correlation coefficients exist at multiples of 200 ms lags.
The power spectrum clearly shows that RTTs are periodic at 5 Hz
and 10 Hz, which is an identical pattern to the frequencies of the
position updates. Furthermore, the counting process of packet loss
events within each 100 ms exhibits strong periodicity in the
correlogram and power spectrum, as shown in
Fig. 15(c) and (d) respectively. Again, the
frequency of packet loss echoes that of the server position updates.
The phenomenon whereby both RTT and packet loss are correlated with
the position updates sent in bursts evidences our conjecture that
periodicity rooted in the system degrades network
performance.
Figure 15: (a)(b) Correlogram and power spectrum of time
series formed by the average RTT every 5 ms; (c)(d) Correlogram and
power spectrum of time series formed by the number of dropped packets
every 100 ms
The common design pattern of network games tends to send out
periodic and synchronized state updates, where the
periodicity comes from a predefined update frequency, and the
synchronization comes from batch message dispatches with a loop for
all clients. Furthermore, the synchronization can be propagated into
other parts of the system, since certain actions that act as
response to commands from the opposite party may release more
messages accordingly. We remark that, though this design is
relatively simple and intuitive, it can have an adverse impact on
network performance.
5.3 Burstiness and Self-Similarity
Earlier, we noted the large-scale correlations and periodicity in
aggregate traffic. We now further investigate the variability of
aggregate traffic in coarser time scales. As the traffic burstiness
of individual game connections has been shown to be in-between that
of Poisson arrivals and TELNET connections
(Section 4.5), we first check how their
traffic variability varies from flow multiplexing.
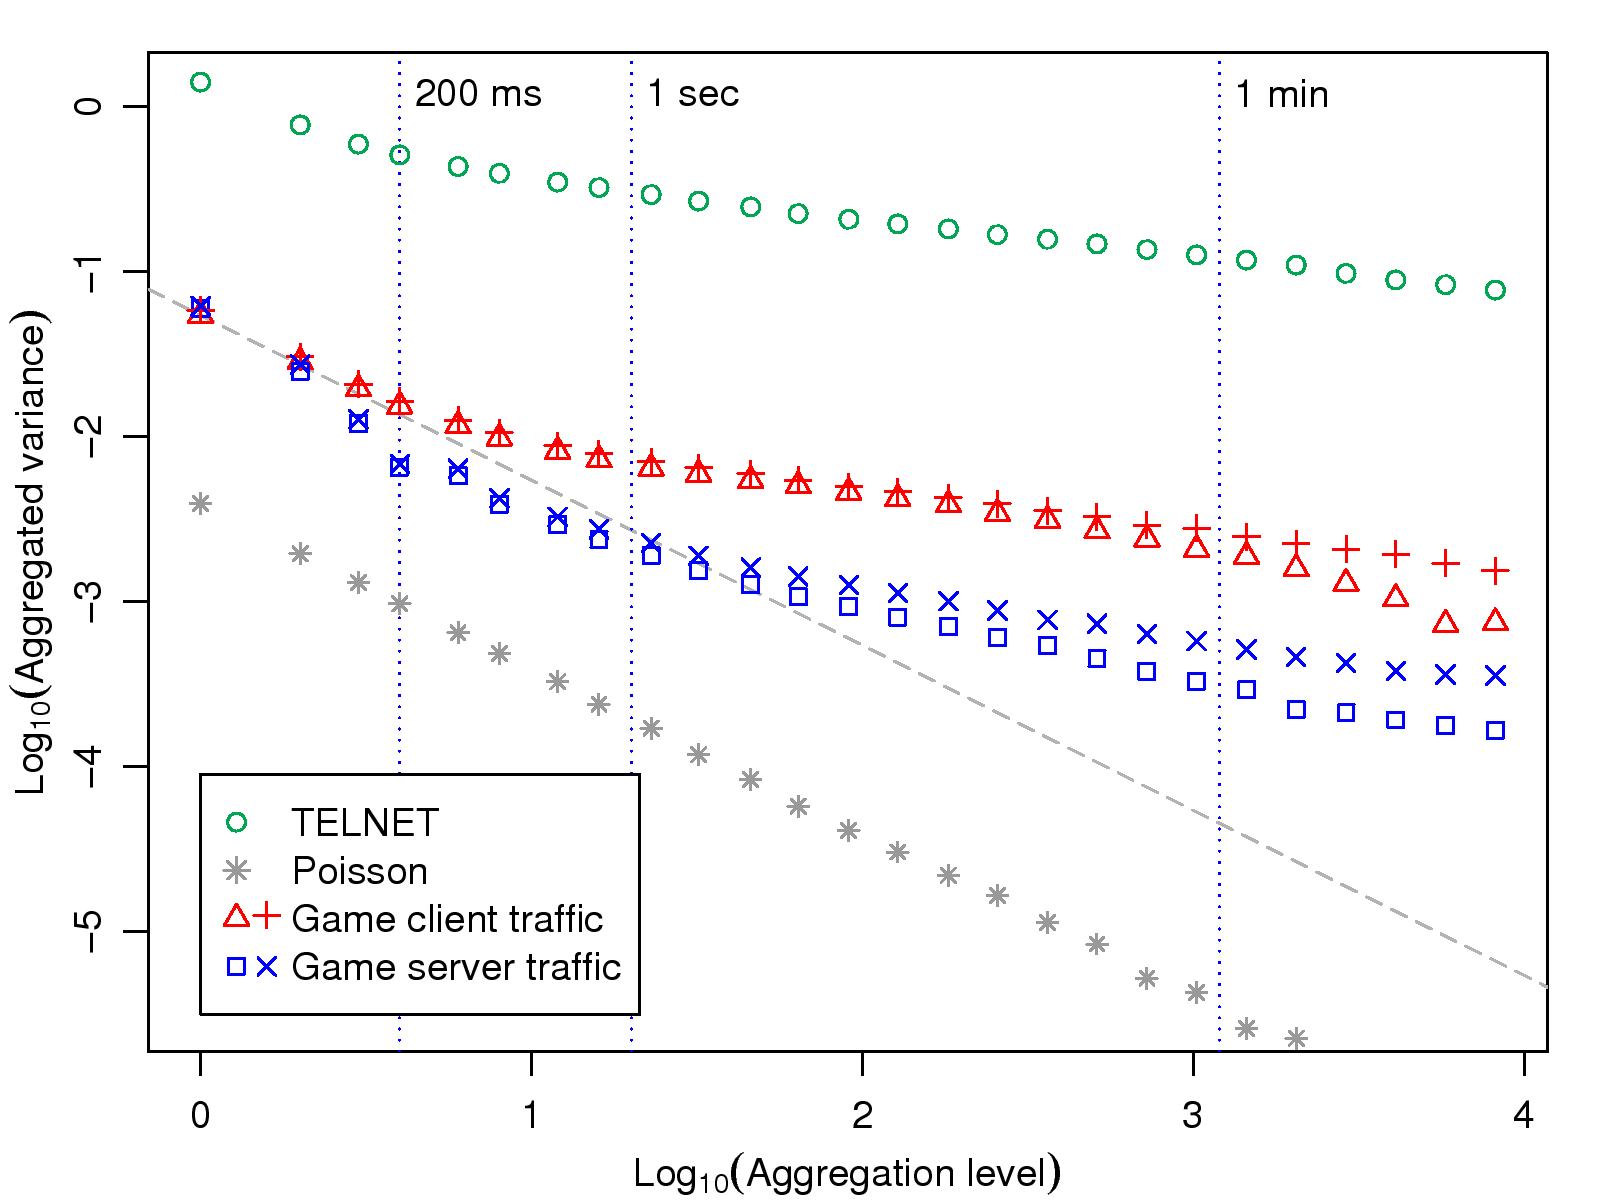
To this end, in Fig. 16, we draw variance-time plots for
the aggregate game traffic, and the LBL-TCP3 TELNET traffic,
as well as a simulated trace of the aggregate Poisson arrivals. In
this method, the counting process is divided into multiple,
consecutive, equal sized, blocks. For each block size, which is 2
through 104 in our case, an aggregate process is composed
by averaging the values within each block. The variance-time plot is
formed by plotting the variances of the aggregated processes versus
the aggregation level (block size), on a log-log scale. For
comparison between processes with different packet numbers, all
processes are normalized to an average rate of 1 pkt/sec before
computing their variances over different aggregation levels. We also
ensure the same degree of multiplexing by counting only the longest
250 TELNET connections in the LBL-TCP3 trace, as 250
connections are multiplexed in the sampled game traffic.
Fig. 16 indicates that, on aggregate, game traffic in both
directions is much less bursty than TELNET traffic; however, it is
more bursty than the aggregate Poisson arrival process, which is
multiplexed by 250 i.i.d. exponential inter-arrival processes. The
relative burstiness of game traffic compared to the TELNET and
Poisson processes is approximately the same with and without flow
multiplexing, except that the server traffic of individual
connections can be smoother than Poisson arrivals in small time
scales (see Fig. 11). At aggregation levels
M around 4 (equivalent to 200 ms), the variances of game
server traffic decay more quickly than 1/M, indicating that the
process has less persistent auto-correlations than Poisson
processes, or periodicity exists. We believe this is caused by the
periodicity and synchronization between connections rooted in the
game's design, which we identified in Section 5.2.
Figure 16: Variance-Time Plot for the packet arrival processes. The
line from the upper left corner has a slope of −1.
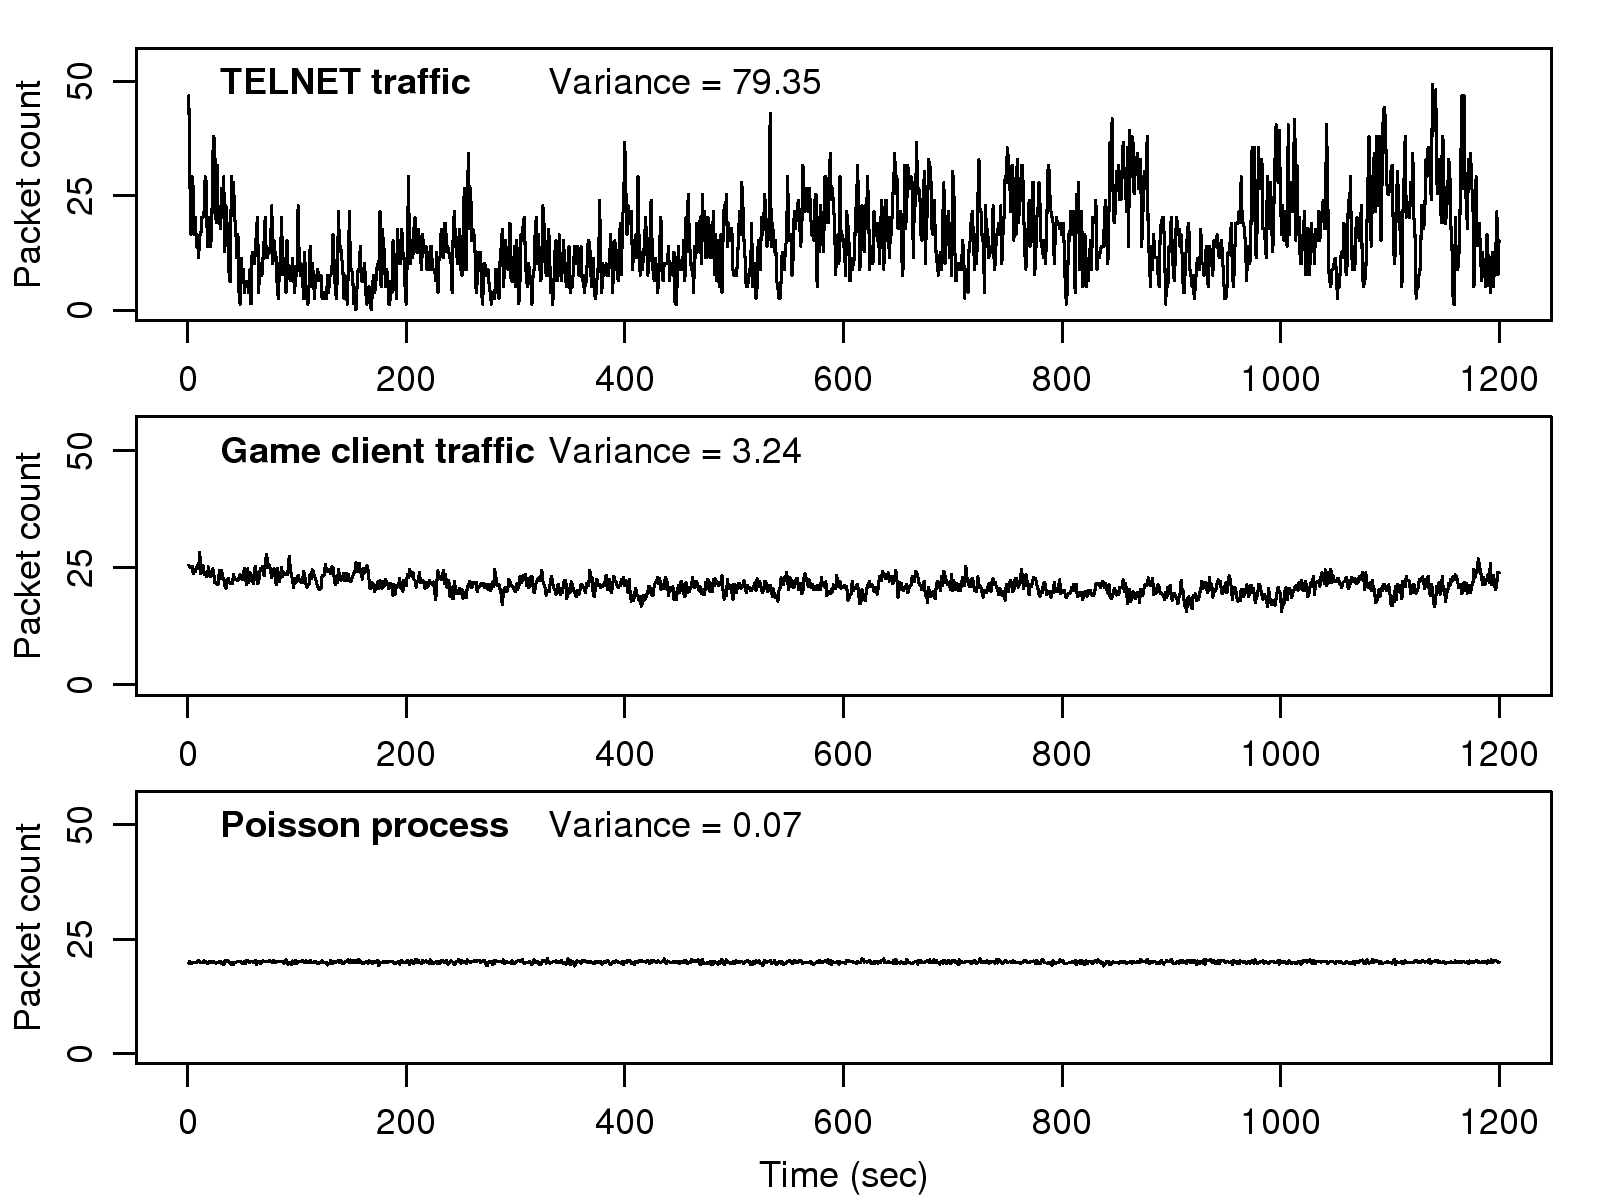
To visually grasp the discrepancy between traffic of different
applications, in Fig. 17, we plot the
arrival processes corresponding to 1-second intervals (M=20) for
TELNET traffic, game client traffic, and Poisson processes, each
with a multiplexing level of 250. As can be seen from the figure,
TELNET traffic is much more bursty than the other traffic types.
While the Poisson process has a variance of 0.07 and game client
traffic has a variance of 3.24, TELNET traffic has a variance of
79.35. This indicates that game traffic is much less bursty than
TELNET traffic, and relatively close to Poisson processes in small
time scales. The large discrepancy between TELNET traffic and game
traffic originates at the connection-level packet interarrivals,
because TELNET packet interarrival times are heavy-tailed, whereas
game client packet interarrival times are close to exponential. In
addition, the periodic mechanisms and synchronization between game
clients further reduce the burstiness of game traffic.
Figure 17: Comparison of aggregate TELNET traffic,
game client traffic, and Poisson processes
The variance-time plot is also a means of testing the scaling
property. Except for an initial dip, the aggregated variances of
game traffic are approximately linear and the slope of the downtrend
is flatter than −1, which is an indicator of (asymptotic)
second-order self-similarity [17]. The Hurst parameter H
can be estimated by taking the magnitude of the slope β of the
best-fit line through the data points with the relation
H=1−[(β)/2]. In our case, the Hurst parameters are
estimated as about 0.85 for client traffic and about 0.8 for
server traffic, both of which suggest long-range dependence and
possibly second-order self-similarity.
However, the estimation of Hurst parameters has been shown to be
unreliable for certain effects in processes, such as trends,
periodicity, and non-stationarity. We can remove trends and
non-stationarity by carefully designed sub-sampling and a short
sampling interval. Periodicity, however, cannot be easily removed
without loss of sampling accuracy, since we do not know whether a
packet was sent due to periodic mechanisms or not. As we were aware
of the frequency components in the game traffic, mainly 5 Hz and
6 Hz, we ran a simulation study to investigate the influence of
such frequency components on the estimation of the Hurst parameter.
In the simulation, a fractional Gaussian noise (FGN) process of the
same length and the same mean (1 pkt/sec) as game traffic was
generated; after that, a 5 Hz noise, which is a uniform random
variable with a range of (0.5, 1) packet, was added. To mimic the
real-life randomness in the periodic release of packet bursts, i.e.,
the intervals between periodic bursts are not exactly the same, the
time slots where noise was added were disturbed by a zero-mean
normal random variable with a standard deviation of 40 ms. To
determine the effect of periodic noise, we adopted wavelet
multiresolution analysis [18] to examine and compare the
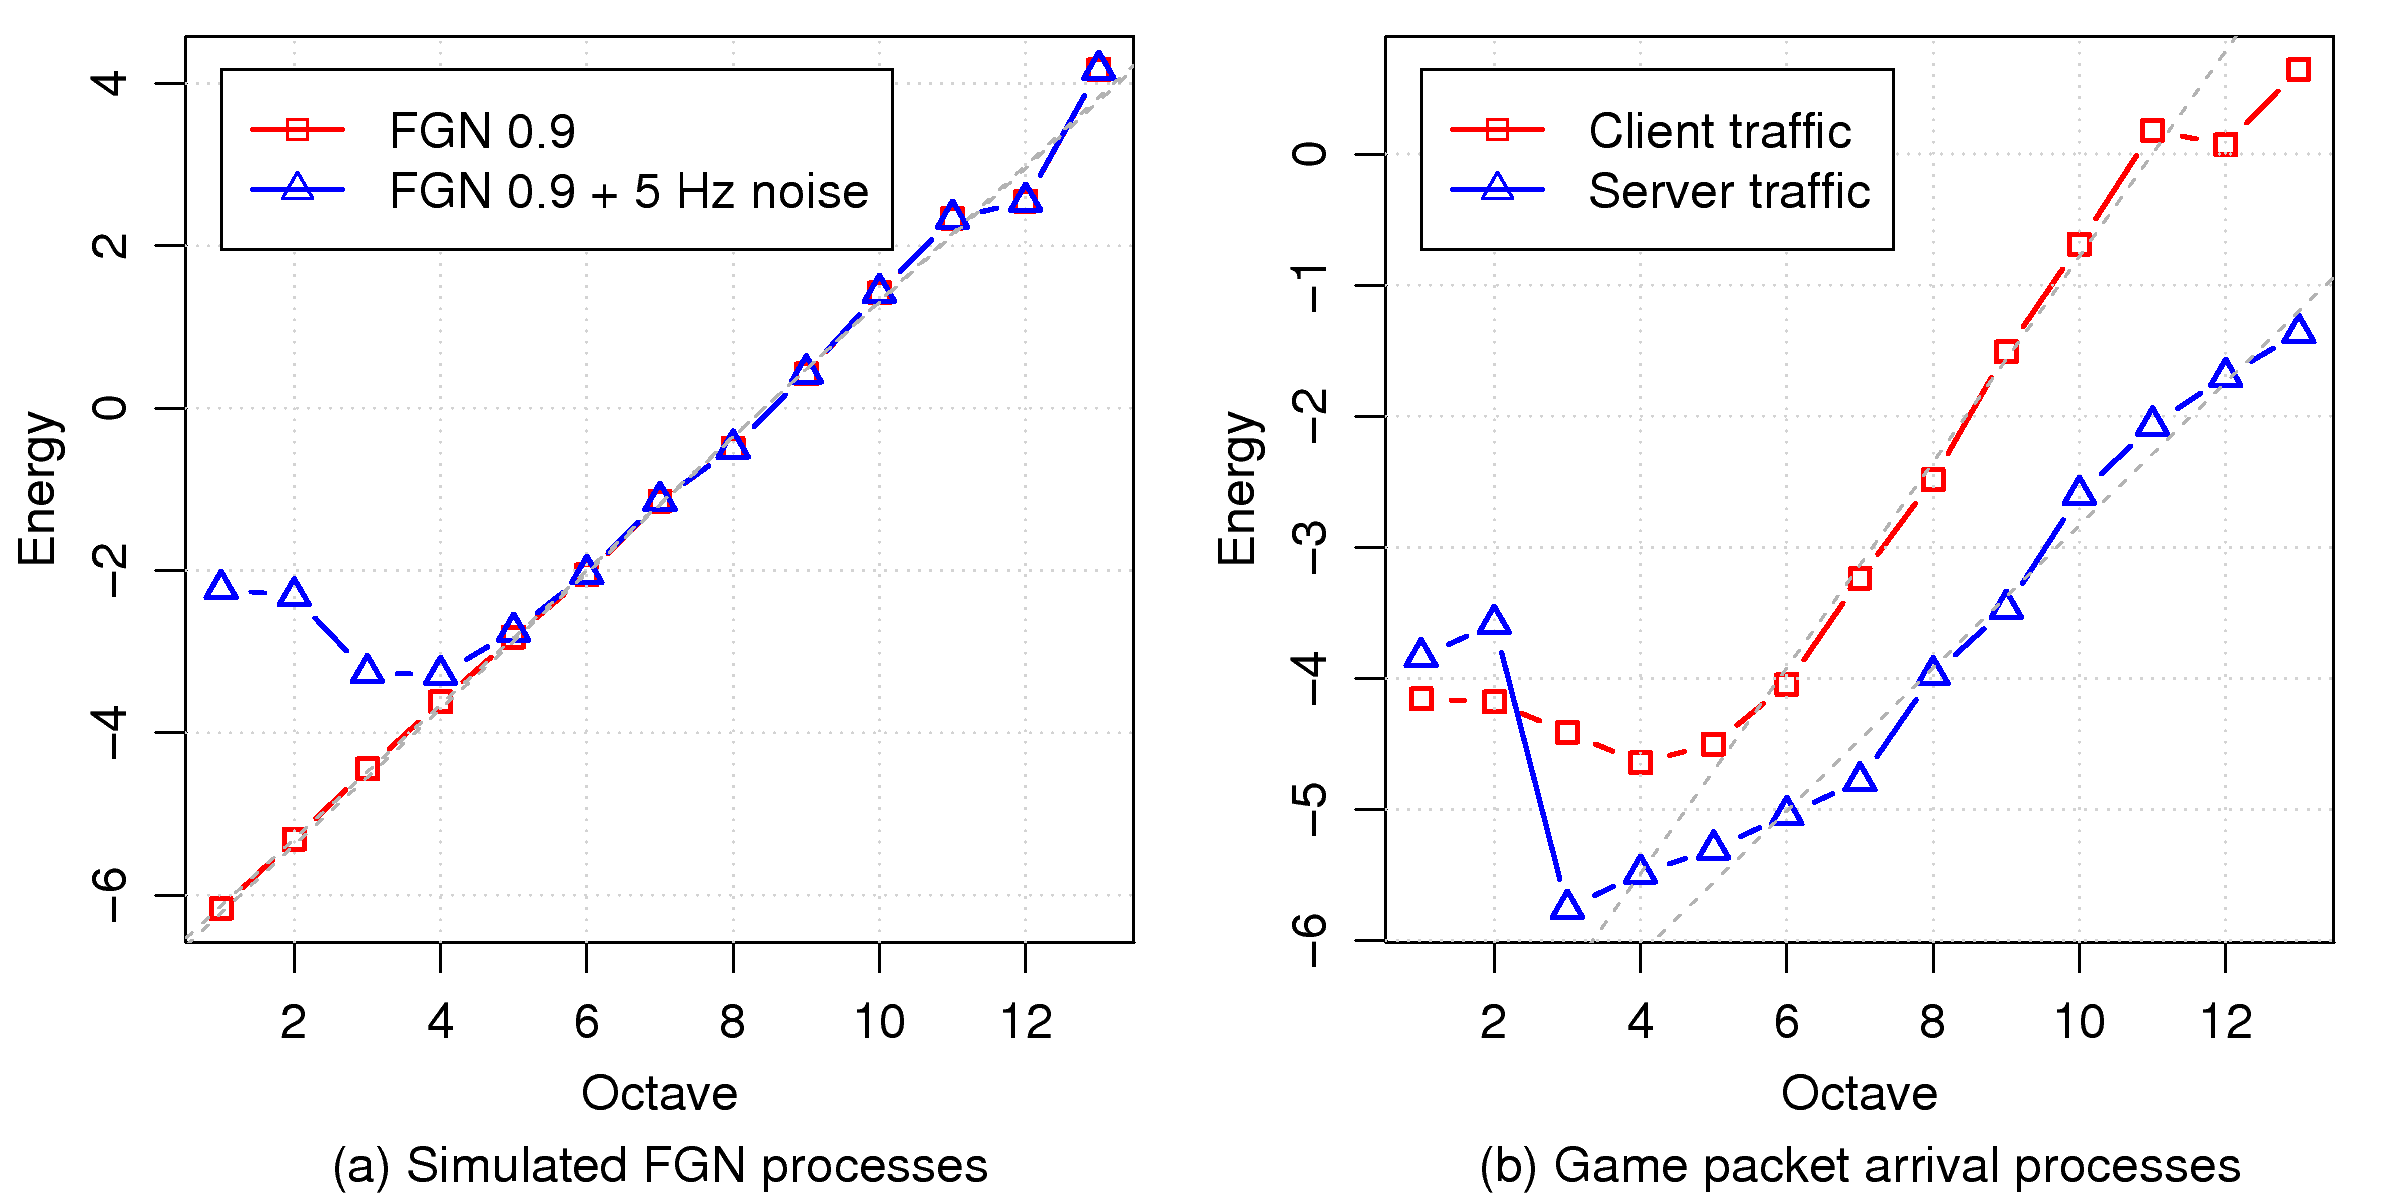
scaling property of the perturbed FGN processes and game traffic. As
shown in Fig. 18(a), the energy of the perturbed FGN
process deviates substantially from that of the original FGN process
over time scales smaller than 200 ms, where the energy increases
significantly due to 5 Hz noise. Turning to
Fig. 18(b), we can see that the trend of wavelet
energy of game traffic shows the same effect observed in the FGN
simulation, where the non-linear part at small time scales is
attributable to periodicity. Thus, we can safely disregard time
scales where the energy is disturbed by the periodicity, and focus
only on time scales coarser than 200 ms, i.e., the fifth octave
and higher. As a result, we observe that energy at those larger
scales ( > 200 ms) is approximately linear, which also suggests
self-similarity.
Figure 18: The scaling property using wavelet multiresolution
analysis
Periodicity affects other estimation methodologies in a similar
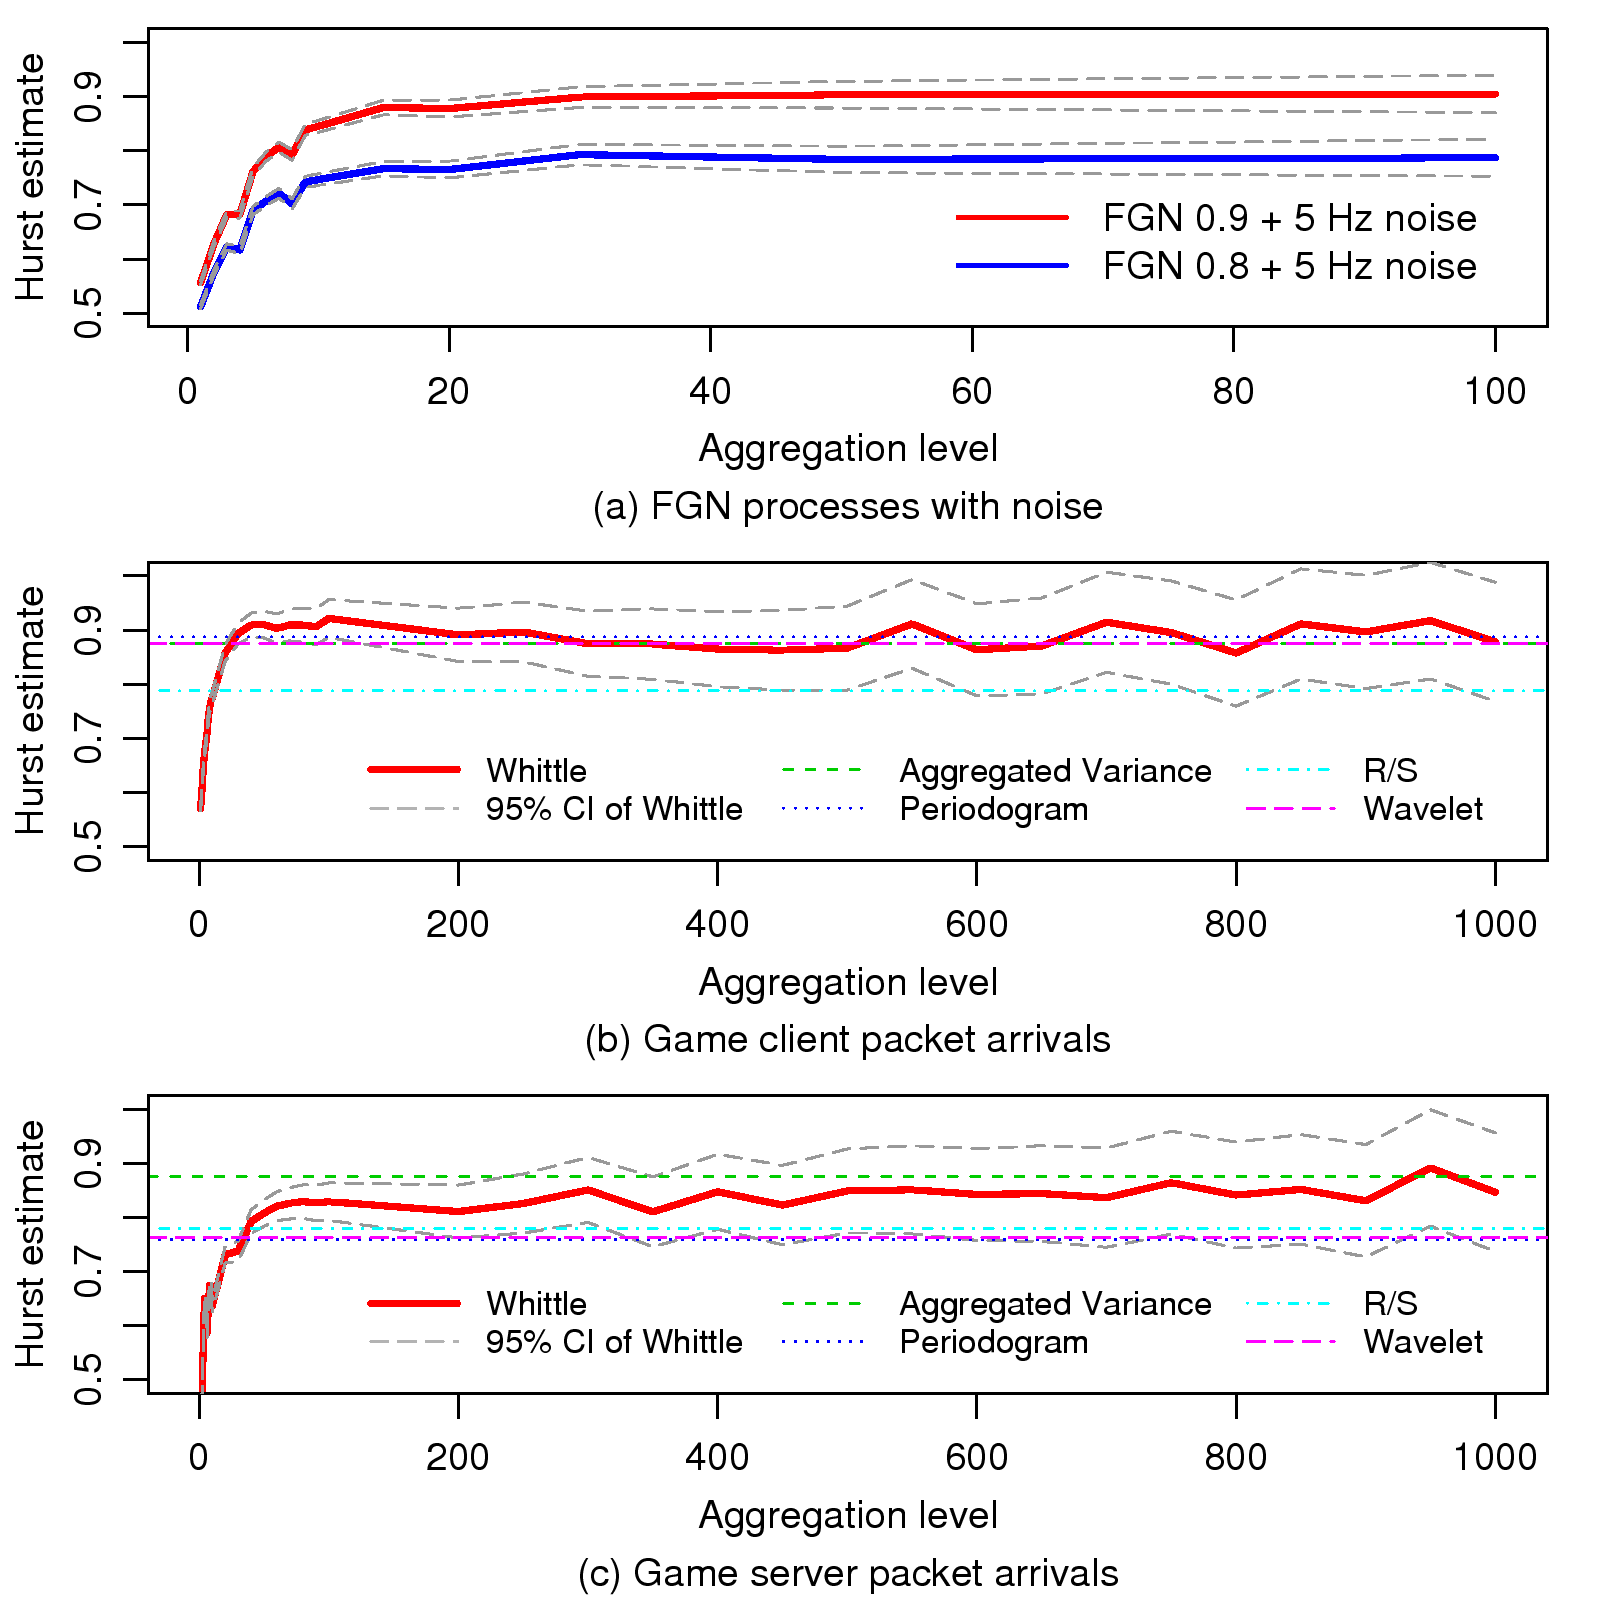
manner. In Fig. 19, we provide the Hurst estimates for
game traffic in both directions and simulated FGN processes over
different aggregation levels. The Hurst estimators we use include
the Whittle estimator, aggregated variance method, R/S
(rescaled-adjusted range plot) method, periodogram method, and
wavelet method. In the upper plot, we show that the Hurst estimate
is not stable until the aggregation level is greater than 50
( ≈ 2.5 sec) for the Whittle estimator, which is usually
considered robust. In the middle and lower plots, the Whittle
estimate, as well as its 95% confidence intervals, for game
traffic in both directions over aggregation levels up to 1,000
( ≈ 50 sec), are provided. Here, the Hurst estimates, except
that of the Whittle estimator, are fixed at aggregation level 50.
As can be seen, the Whittle's Hurst estimate remains constant over a
wide range of time scales. The Hurst estimates by other methods
generally agree with each other, and are roughly within the
confidence intervals of the Whittle estimates, at least for large
aggregation levels. As a result, the Hurst parameter we estimated is
within (0.85, 0.9) for game client traffic, and within (0.8,0.85) for server traffic. Though not listed here, the results drawn
from all two-hour intervals of our game traces are consistent with
the above findings.
Figure 19: Hurst estimates for simulated FGN processes and game
traffic in both directions
With regard to the question of why self-similarity exists in
game traffic, we find that the heavy-tailed ON/OFF
source-model provides a reasonable explanation [17]. We
define ON- and OFF-periods as corresponding to a player's
activity and idle periods respectively; consequently,
the game client for each connection can be modeled as a strictly
alternating ON/OFF source. Since game clients send certain packets,
such as keep-alive messages or information queries about the
environment even when a character is completely idle, we cannot
simply treat a client data packet as an action issued by the player.
To examine the distribution of ON/OFF periods for individual
connections, we compute the average client data packet rates in
4-second intervals. Based on the histograms of the packet rates
sampled, we choose a threshold of 1.5 pkt/sec to determine whether
a player is "active" or "idle" in a certain interval. The
sampling interval is chosen arbitrarily so that it can capture the
active and idle behavior of players' activity; however, we find that
different intervals, e.g., 1-second through 10-second intervals,
lead to similar results.
A distribution of a random variable X is heavy-tailed if
P[X > x] ∼ x − αas x →∞,
(1)
where the power-law exponent, α, is within the range
0 < α < 2. According to [17], the aggregate traffic of
multiplexed connections is self-similar if the traffic within
individual connections can be modelled as ON/OFF periods, and either
ON- or OFF-periods are heavy-tailed distributions with 1 < α < 2.
After the ON- and OFF-periods for each connection have been
computed, we can then estimate the heaviness of their tail
distributions, i.e., whether the tail distributions of
ON/OFF-periods conform to 1 < α < 2.
However, in our traces, ON/OFF periods were censored due to
the beginning and termination of the measurement, i.e., we did not
observe the full span of some periods, so the exact length of each
of those periods is unknown. Furthermore, since long periods are
more likely to be censored, we cannot simply estimate the tail
heaviness from observed times or only uncensored periods, as this
will lead to underestimating tail heaviness. While the Hill
estimator for right-censored data is available [19],
for randomly-censored data (which is the case with our
ON/OFF-periods), it remains to be extended. Therefore, we adopt a
simple heuristic method to estimate α based on the
Kaplan-Meier survival curves [20] (a brief introduction
is provided in Section 6.2), i.e., we estimate
the complementary cumulative distribution function (CCDF) for both
censored and uncensored observations. Taking the logarithm on both
sides of Eq. 1, we obtain that the logarithm of a
survival curve of X would be linear with a slope of −α if
X follows the power law with exponent α. By this method, we
can obtain an α-estimate based on the slope of the line
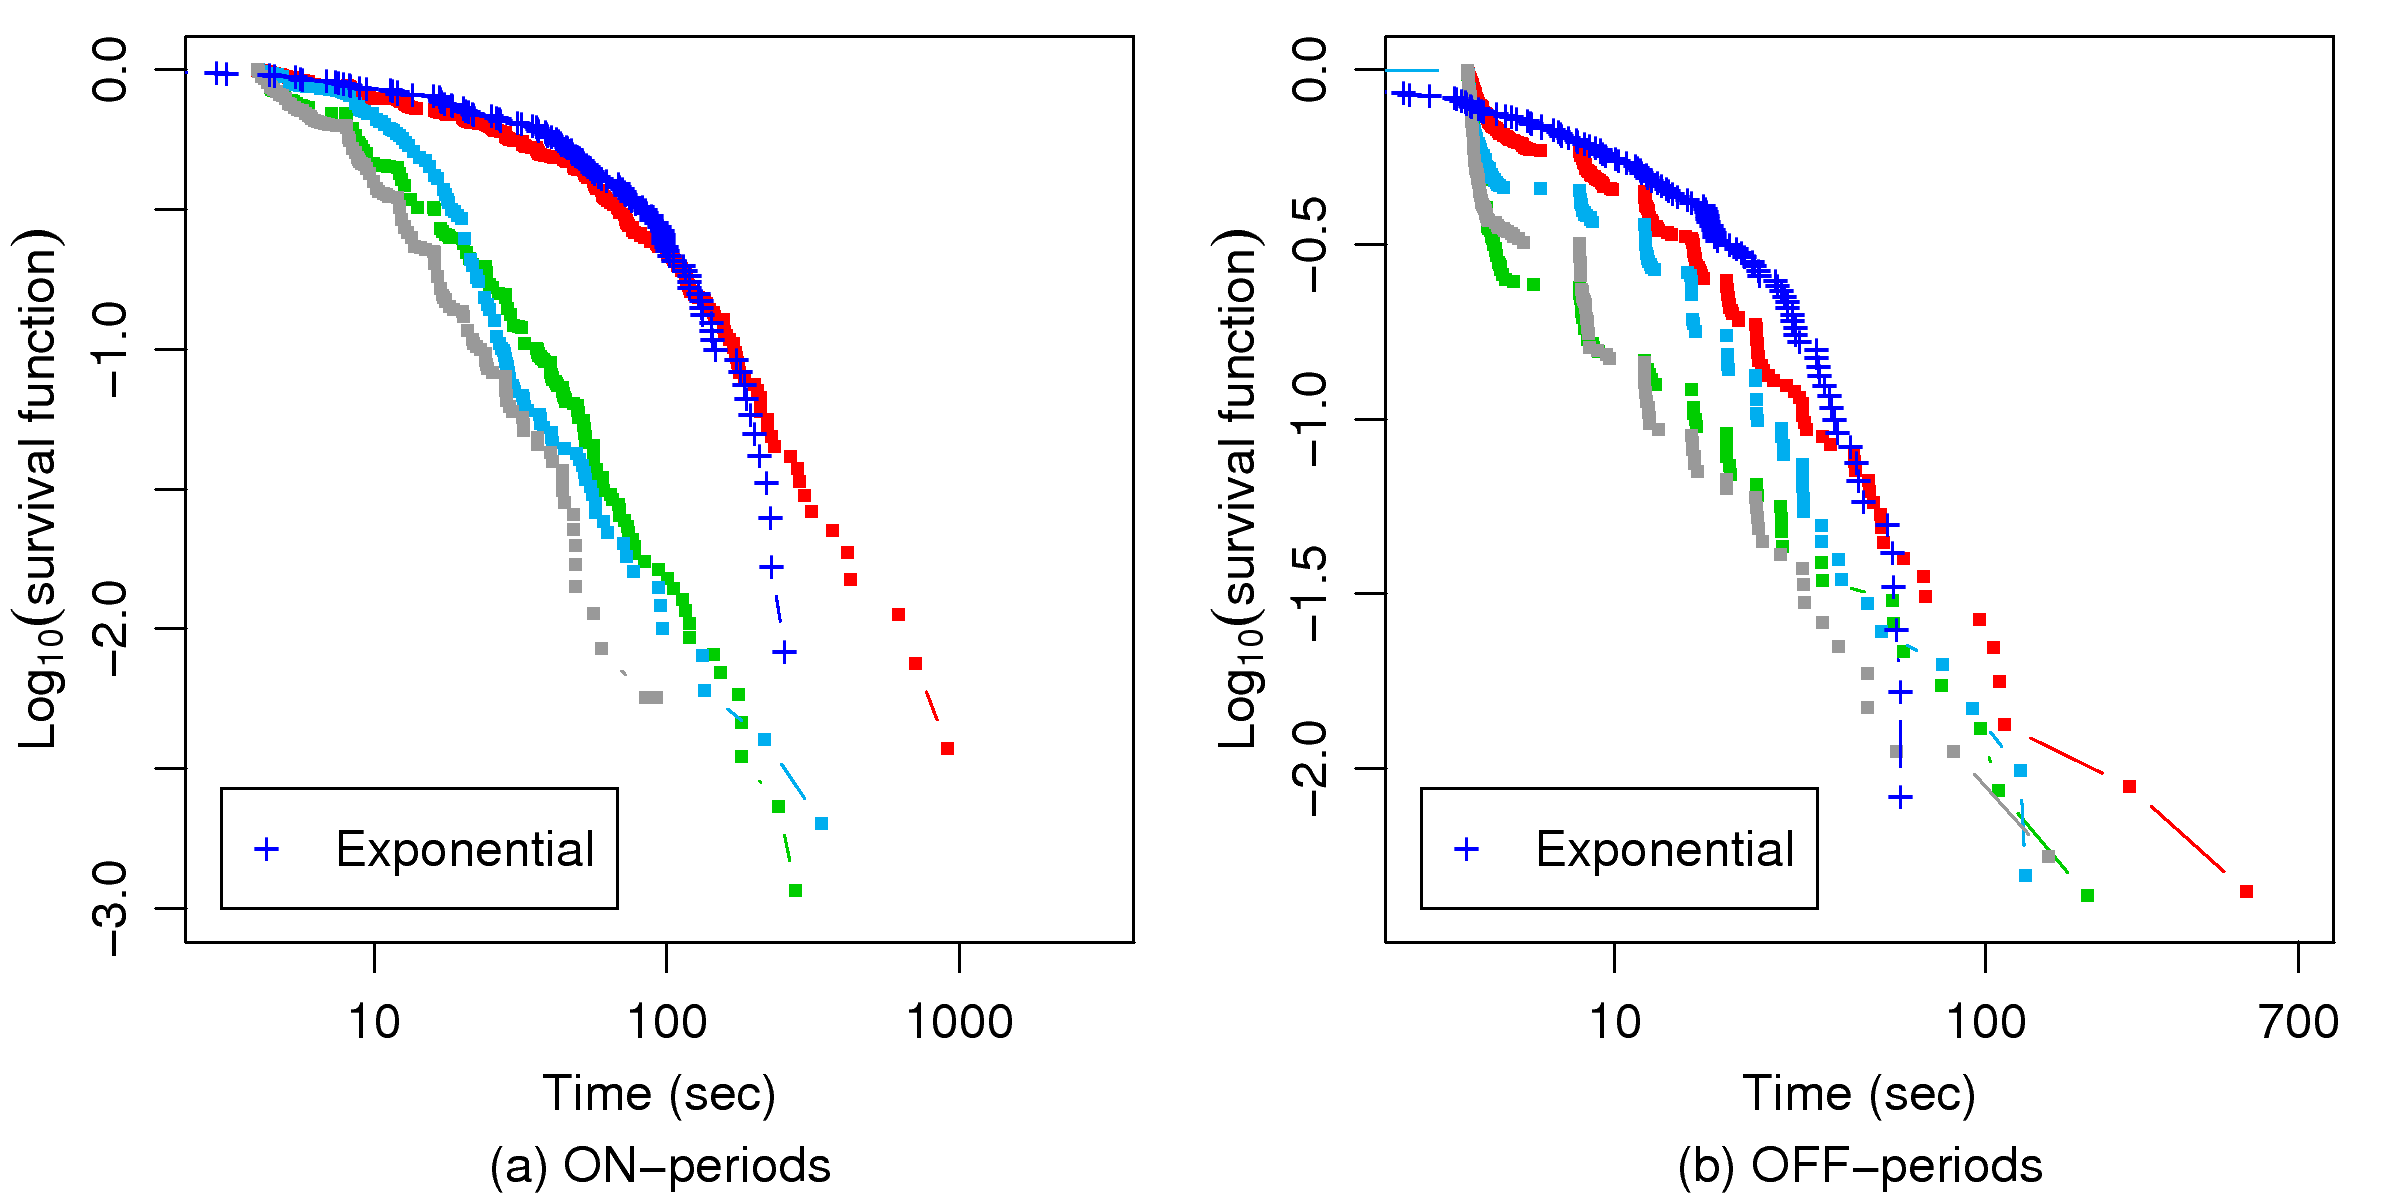
fitted to the log-log survival curve. In Fig. 20,
we draw log-log survival curves for the ON- and OFF-periods of some
connections, where the survival function of an exponential random
variable is also provided for reference. In the plots, we observe
that both ON- and OFF-periods, especially OFF-periods, tend to be
heavy-tailed in that their tail distribution is approximately
linear.
We can see that the distribution of game session times declines more
slowly than the exponential distribution, especially in the tail
portion.
Figure 20: Log-Log survival curves of ON/OFF-periods within
connections
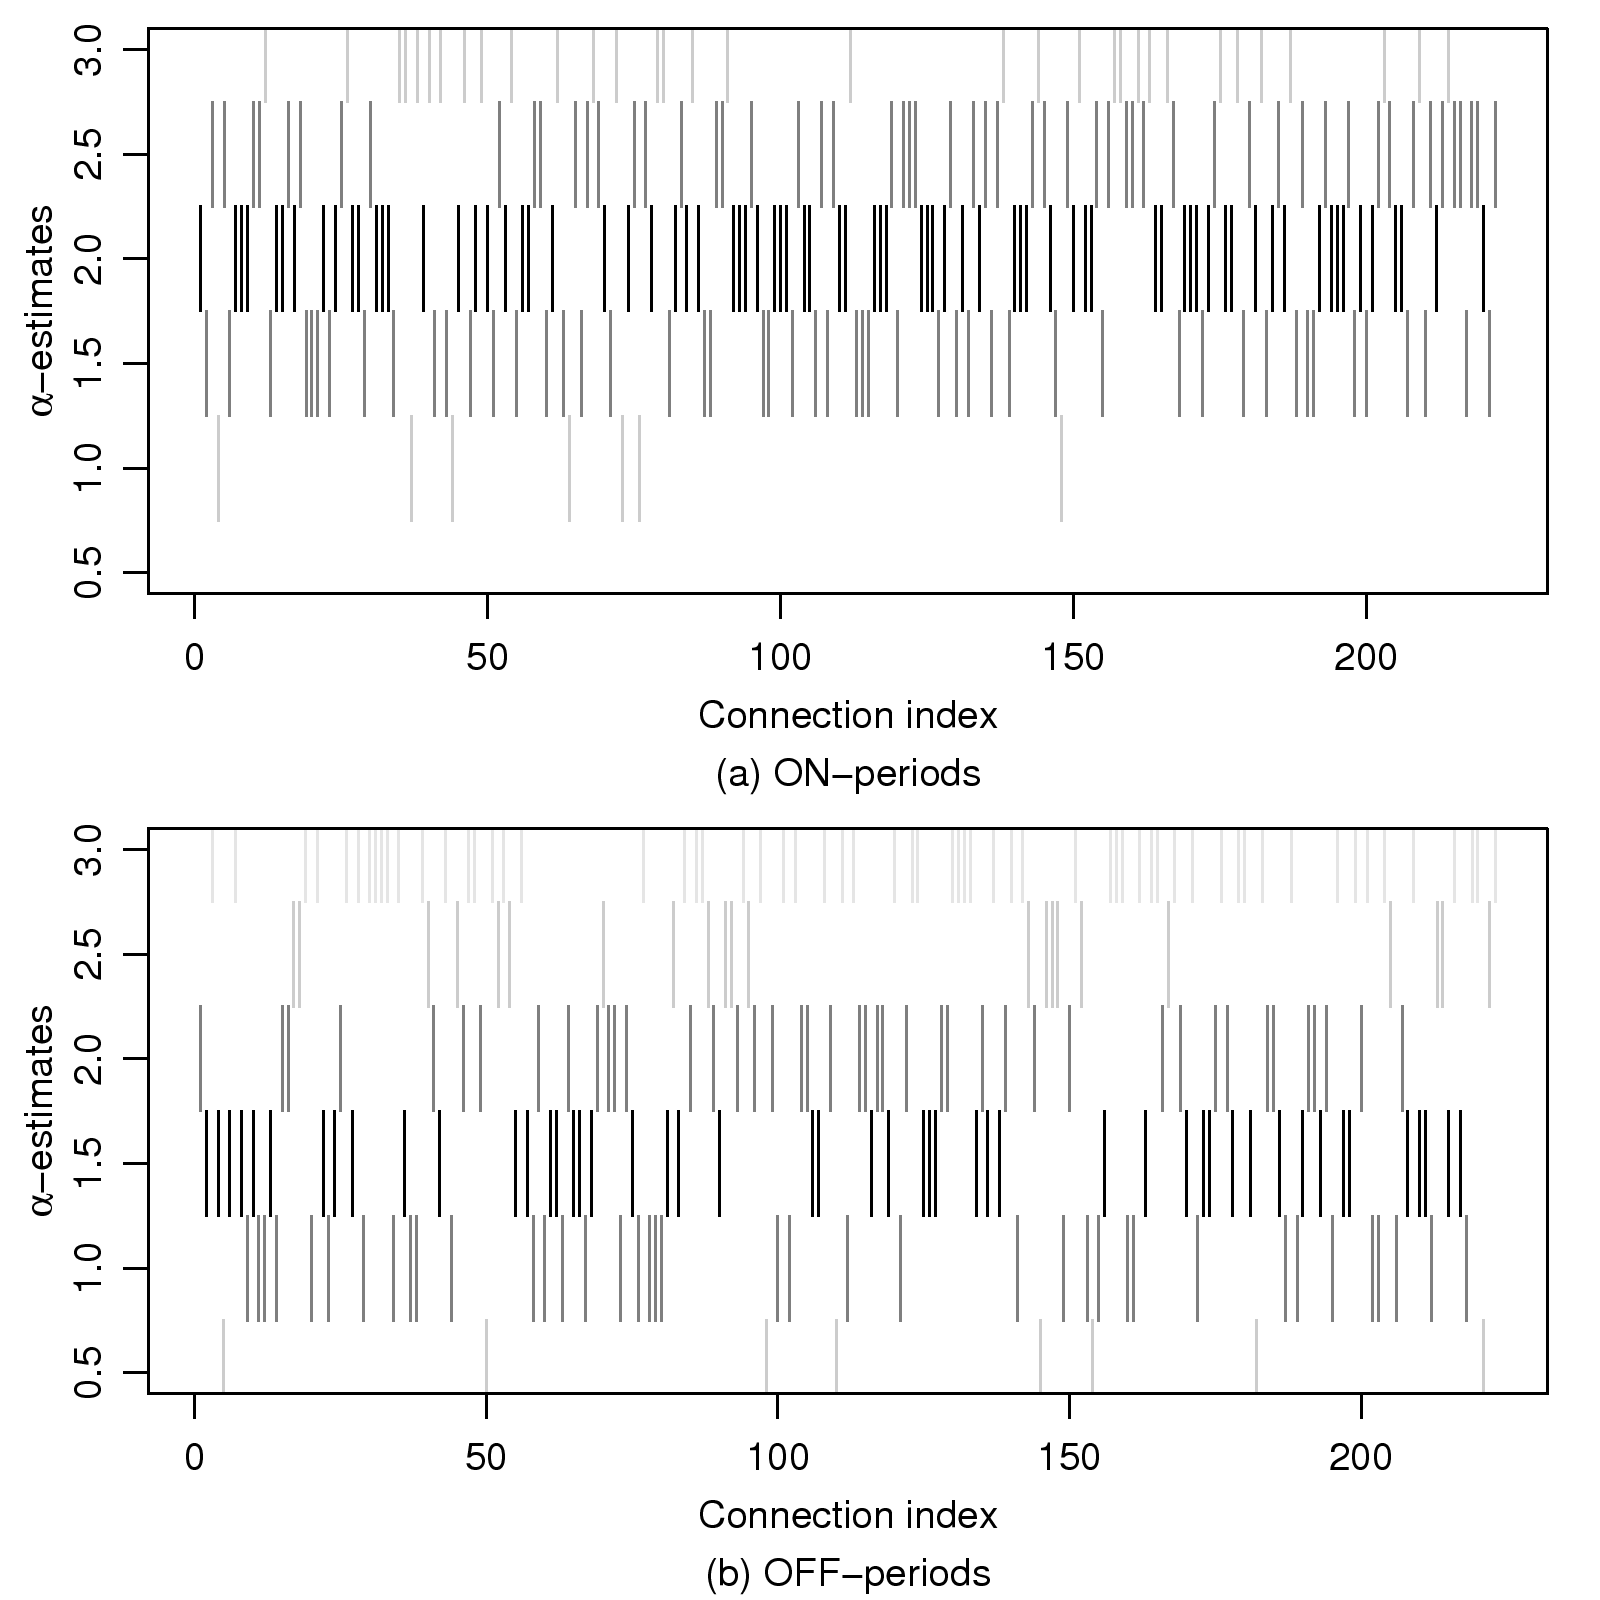
Figure 21: Summary plots of the ranges for the
α-estimates for ON-periods and OFF-periods of 223
connections.
In order to check the heavy-tailedness of ON/OFF-periods, we
extracted 223 connections that spanned more than two hours and
contained more than 150 ON/OFF-periods. To estimate α, we
used a linear regression on the tail 20% of the observations. To
visually grasp the α estimates for different connections, we
categorized the α-estimates in intervals of (0,.75),
(.75,1.25), (1.25,1.75), (1.75,2.25), (2.25,2.75),
(2.75,∞) and plotted the corresponding ranges for ON- and
OFF-periods respectively, as shown in Fig. 21.
We can see from the figure that the α-estimates for
OFF-periods cover the whole interval (1,2), which is evidence of
heavy-tailedness. About 35% of sessions have α-estimates
outside the range. This is reasonable, because some players never
take a long break during their online time, e.g., users at an
Internet café. Though the number of sessions without
heavy-tailed OFF periods is not insignificant, the majority of
sessions do have heavy-tailed OFF periods and can have a substantial
impact on the overall traffic characteristics.
On the other hand, the α-estimates for ON-periods primarily
cover the range (1.5,2.5), which has generally lighter tails than
OFF-periods and may not be heavy-tailed for a number of connections.
This behavior is plausible, since OFF-periods (idle periods) can be
arbitrarily long, as players can just leave their computers.
ON-periods, however, require players to be active for a long time
without a break, which of course is unlikely to be too long given
the physical limits of human beings. In the ON/OFF source models,
the Hurst parameter is decided by the minimum of α of ON- and
OFF-periods; thus, the OFF-periods with 1 < α < 2 can be seen as
the primary cause of the self-similarity observed in game traffic.
6 Session Characteristics
In ShenZhou Online, the game world is partitioned into a number of maps,
provided by one or more map servers. When a character moves across
map boundaries, if the new map is provided by a different map
server, the game client will disconnect from the original map server
and establish a connection with the new map server. The design
naturally leads to two types of session: 1) map session: the
period a character remains on a map; and 2) game session: the
period a player remains in a game. The map session is of interest to
us, since it is semantically equivalent to a TCP connection, and the
modeling of TCP connections is relevant in traffic modeling. On the
other hand, the game session describes how long a player stays in a
game, which is important in user behavior modeling. For the sake of
brevity, we use "sessions" to denote both map sessions and game
sessions.
In the following, we explore how often players switch maps and join
a game, i.e., the interarrival times of map sessions and game
sessions, respectively. We also investigate the periods that players
remain on a map and in a game, i.e., the duration of map sessions
and game sessions, respectively.
6.1 Interarrivals
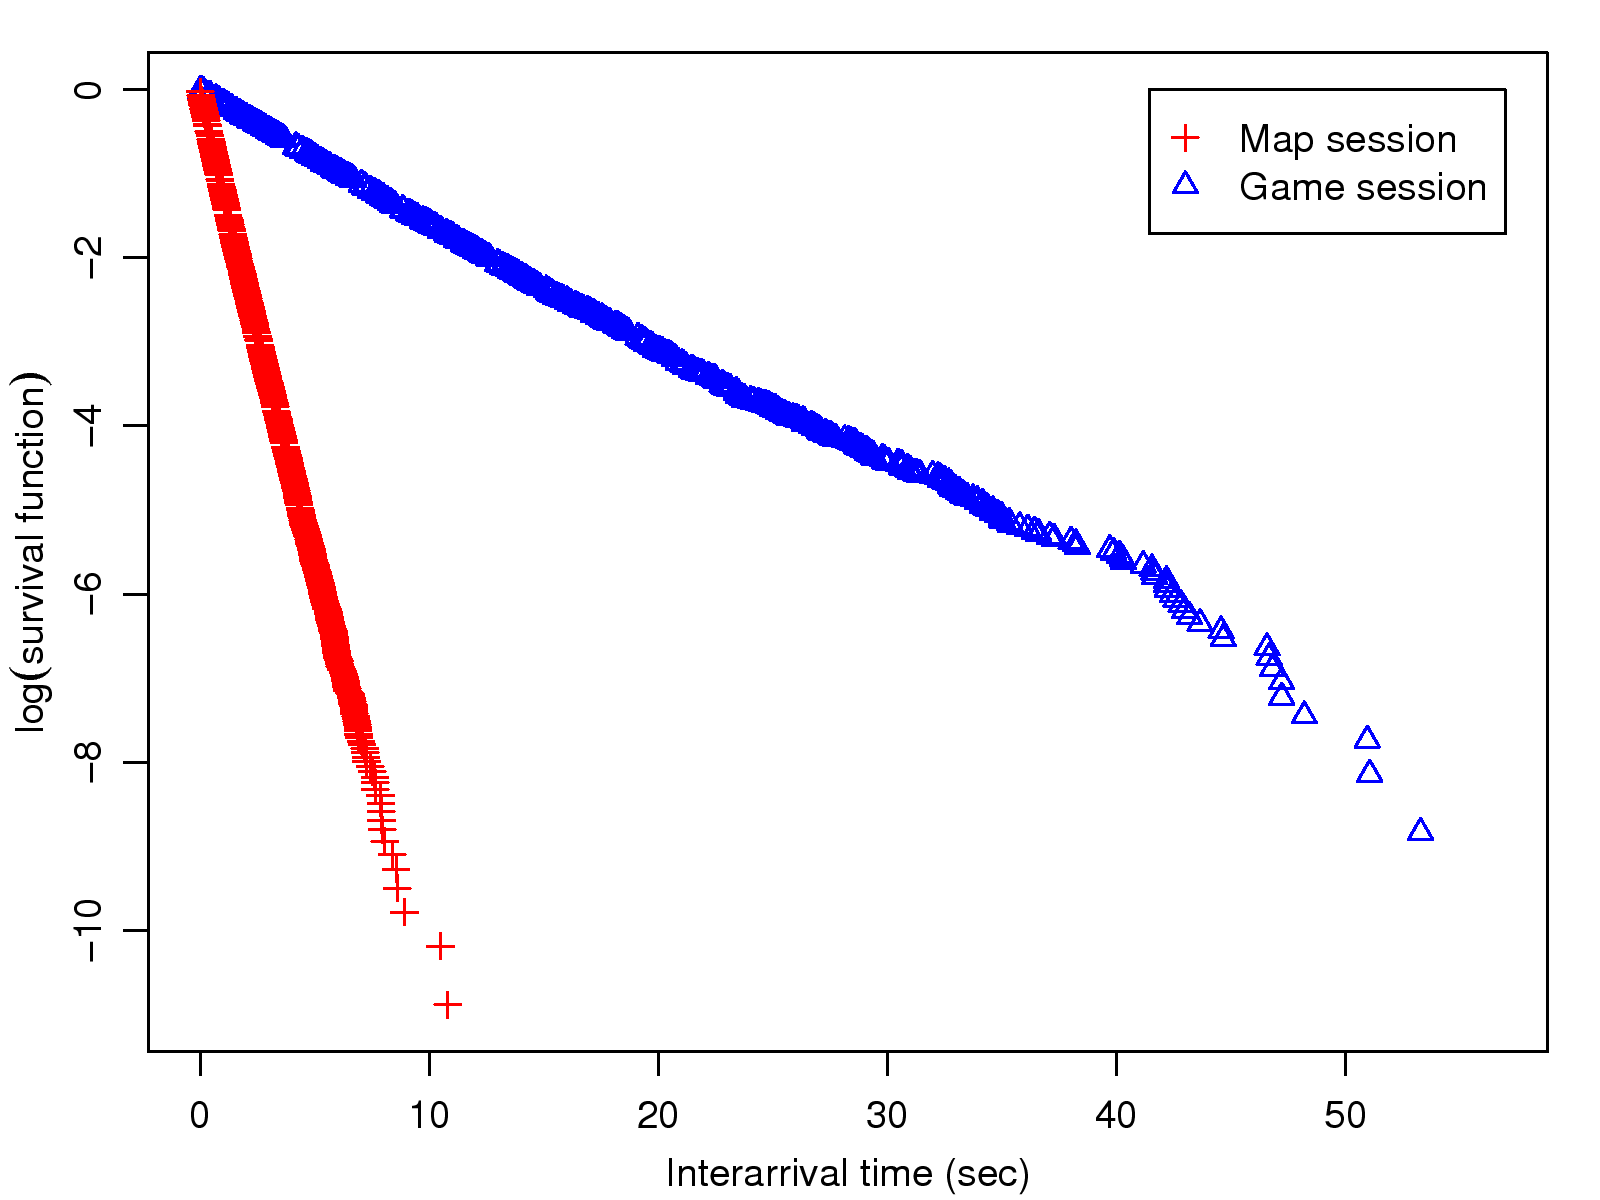
Fig. 22 plots the CCDF of the
interarrival times of map sessions and game sessions, respectively,
with a log-linear scale. We can see that both map sessions and game
sessions are consistent with the exponential distribution, as their
CCDFs are nearly straight on the graph.
In order to evaluate whether the session interarrivals follow a
Poisson arrival process, we use the statistical tests proposed
in [16]. The method tests two aspects of session
interarrivals: whether they are exponentially distributed, and
whether they are independent. We first test the interarrivals for an
exponential distribution using the Anderson-Darling test recommended
by Stephens in [21]. Then, we test the independence of
interarrivals by the auto-correlation functions. For independent
interarrivals, the magnitude of the corresponding auto-correlation
function should not be too large, and there should be approximately
equal numbers of positive and negative auto-correlations (refer
to [16] for details of the tests).
Because of the significant time-of-the-day effect, we cannot expect
session interarrivals from the entire trace to fit a single
homogeneous Poisson model. Instead, we apply the Poisson conformance
test to packet interarrivals in each one-hour interval. With a
significance level of 0.05 for all tests, we find that game
sessions within one-hour intervals conform to homogeneous Poisson
processes. The result is reasonable, since the game sessions were
manually initiated by players. On the other hand, map sessions do
not pass the independence test, even with an interval of ten
minutes. We consider that the temporal dependence of map session
arrivals arises from the common behavior of team play, i.e.,
players usually team up in support of each other. Because team
players move on a map together, a number of map sessions will be
initiated at approximately the same time when a group of
players moves across a map boundary. In recent years, the design of
MMORPGs has tended to encourage even forced players to team up to
solve quests in a game. Therefore, we believe the dependent arrivals
of map sessions is not a unique feature of ShenZhou Online, i.e., it is shared
by many MMORPGs.
Figure 22: Session interarrival times in a
log-linear scale.
Because of the setup of our traffic measurement, some players had
been in the game before the trace started, and some left after the
trace terminated; therefore, we do not know exactly how long those
players stayed in game. We define a session as censored if
only part of it was observed by our network monitor. As a
significant proportion of observed sessions were censored,
statistics only computed from observed time will lead to
underestimation. Therefore, we use statistical methods in
survival analysis, which are capable of handling censored
observations, to compute statistics related to session duration.
By the conventions of survival analysis, we denote a player's
departure as an event or a failure. A survival
function is commonly used to describe the lifetime pattern of an
object or a set of observations. In our context, the survival
function is defined as:
S(t)
=
Pr
(asessionthatsurviveslongerthantime t)
=
1−
Pr
(asessionthatfailsbefore,orattime t)
=
1−F(t),
where F(t) is the cumulative distribution function (CDF) of
session times. A standard estimator of the survival function,
proposed by Kaplan and Meier [20], is called the
Product-Limit estimator or the Kaplan-Meier estimator. Suppose there
are n distinct session times t1, t2, …, tn in ascending
order such that t1 < t2 < … < tn; and that at time ti,
there are di events and Yi active sessions. The survival
function of the random variable T for all values of t ≤ tn is
then defined as follows:
^
S
(t)
=
∏ti ≤ t
Pr
[T > ti |T ≥ ti ]
=
⎧ ⎪ ⎨
⎪ ⎩
1
if t < t1,
∏ti ≤ t [1 −
di
Yi
]
if t1 ≤ t.
Accordingly, the pth quantile of the lifetime, tp, can be
obtained by
tp=
inf
{t:
^
S
(t) ≤ 1−p}.
(2)
With Eq. 2, we can estimate the median session
time for a group of sessions by t0.5, as the median times
listed in Table 2.
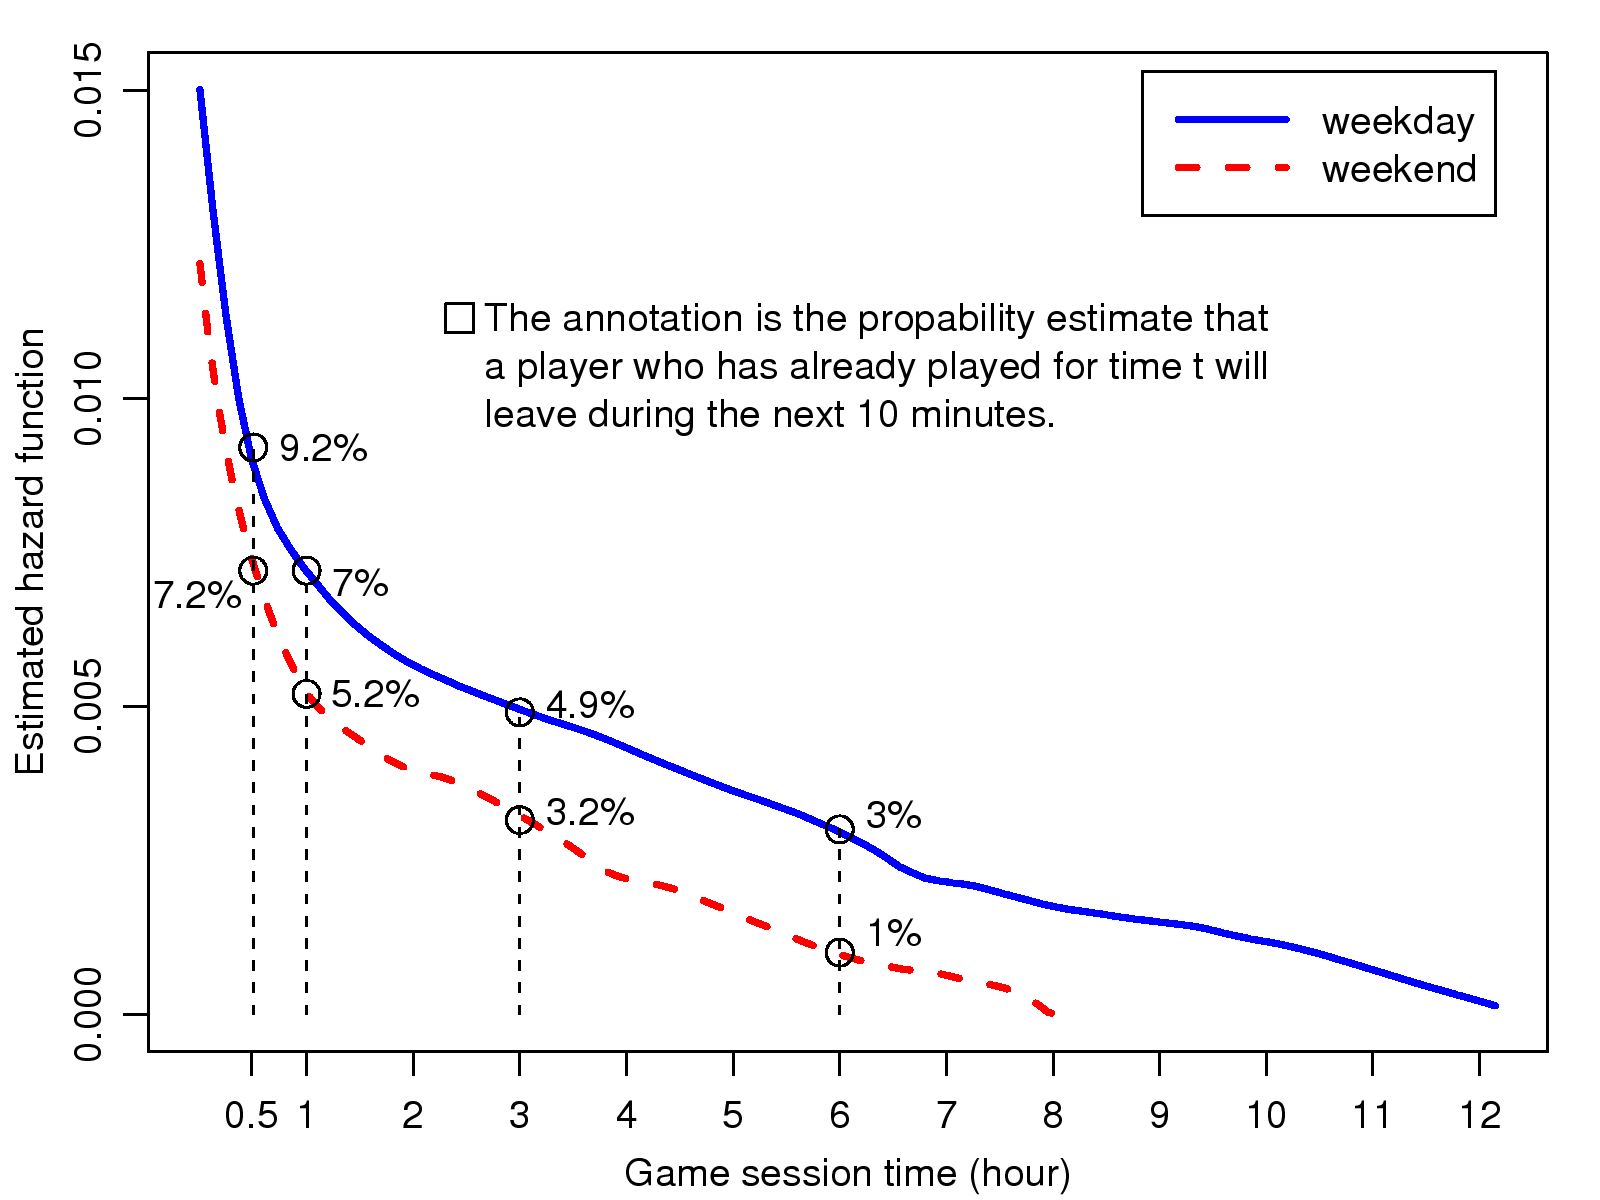
The hazard function gives us a direct way to check the lifetime
pattern of sessions. The hazard function, or the hazard
rate, also known as the conditional failure rate in reliability
engineering, or the intensity function in stochastic processes, is
defined by
h(t) =
lim
∆t → 0
Pr
[t ≤ T < t + ∆t|T ≥ t]
∆t
.
The hazard function gives the instantaneous rate at which
failures occur for observations that have survived at time t. In
the context of game sessions, the quantity h(t)∆t may
therefore be seen as the approximate probability that a
player who has been in a game for time t will leave the game in
the next ∆t period, given that ∆t is small. We
depict the hazard functions estimated for game sessions in
Fig. 23. The distinct hazard functions for
game sessions on weekdays and weekends clearly show a
day-of-the-week effect. Furthermore, both hazard functions
present continuously downward trends. To be more specific,
based on the computed weekday hazard function, the probability that
a player will leave a game within a short time (10 minutes) when
he has been in the game for 30 minutes, 1 hour, 3 hours, and
6 hours is approximately 9.2%, 7%, 4.9%, and 3%,
respectively. The decreasing failure rate indicates that a
player who has played for a long time tends to stay longer, which
is a remarkable feature of heavy-tailed distributions. The hazard
functions of map sessions (not provided here) exhibit similar
behavior of constantly downward trends.
Figure 23: Estimated hazard function for game sessions
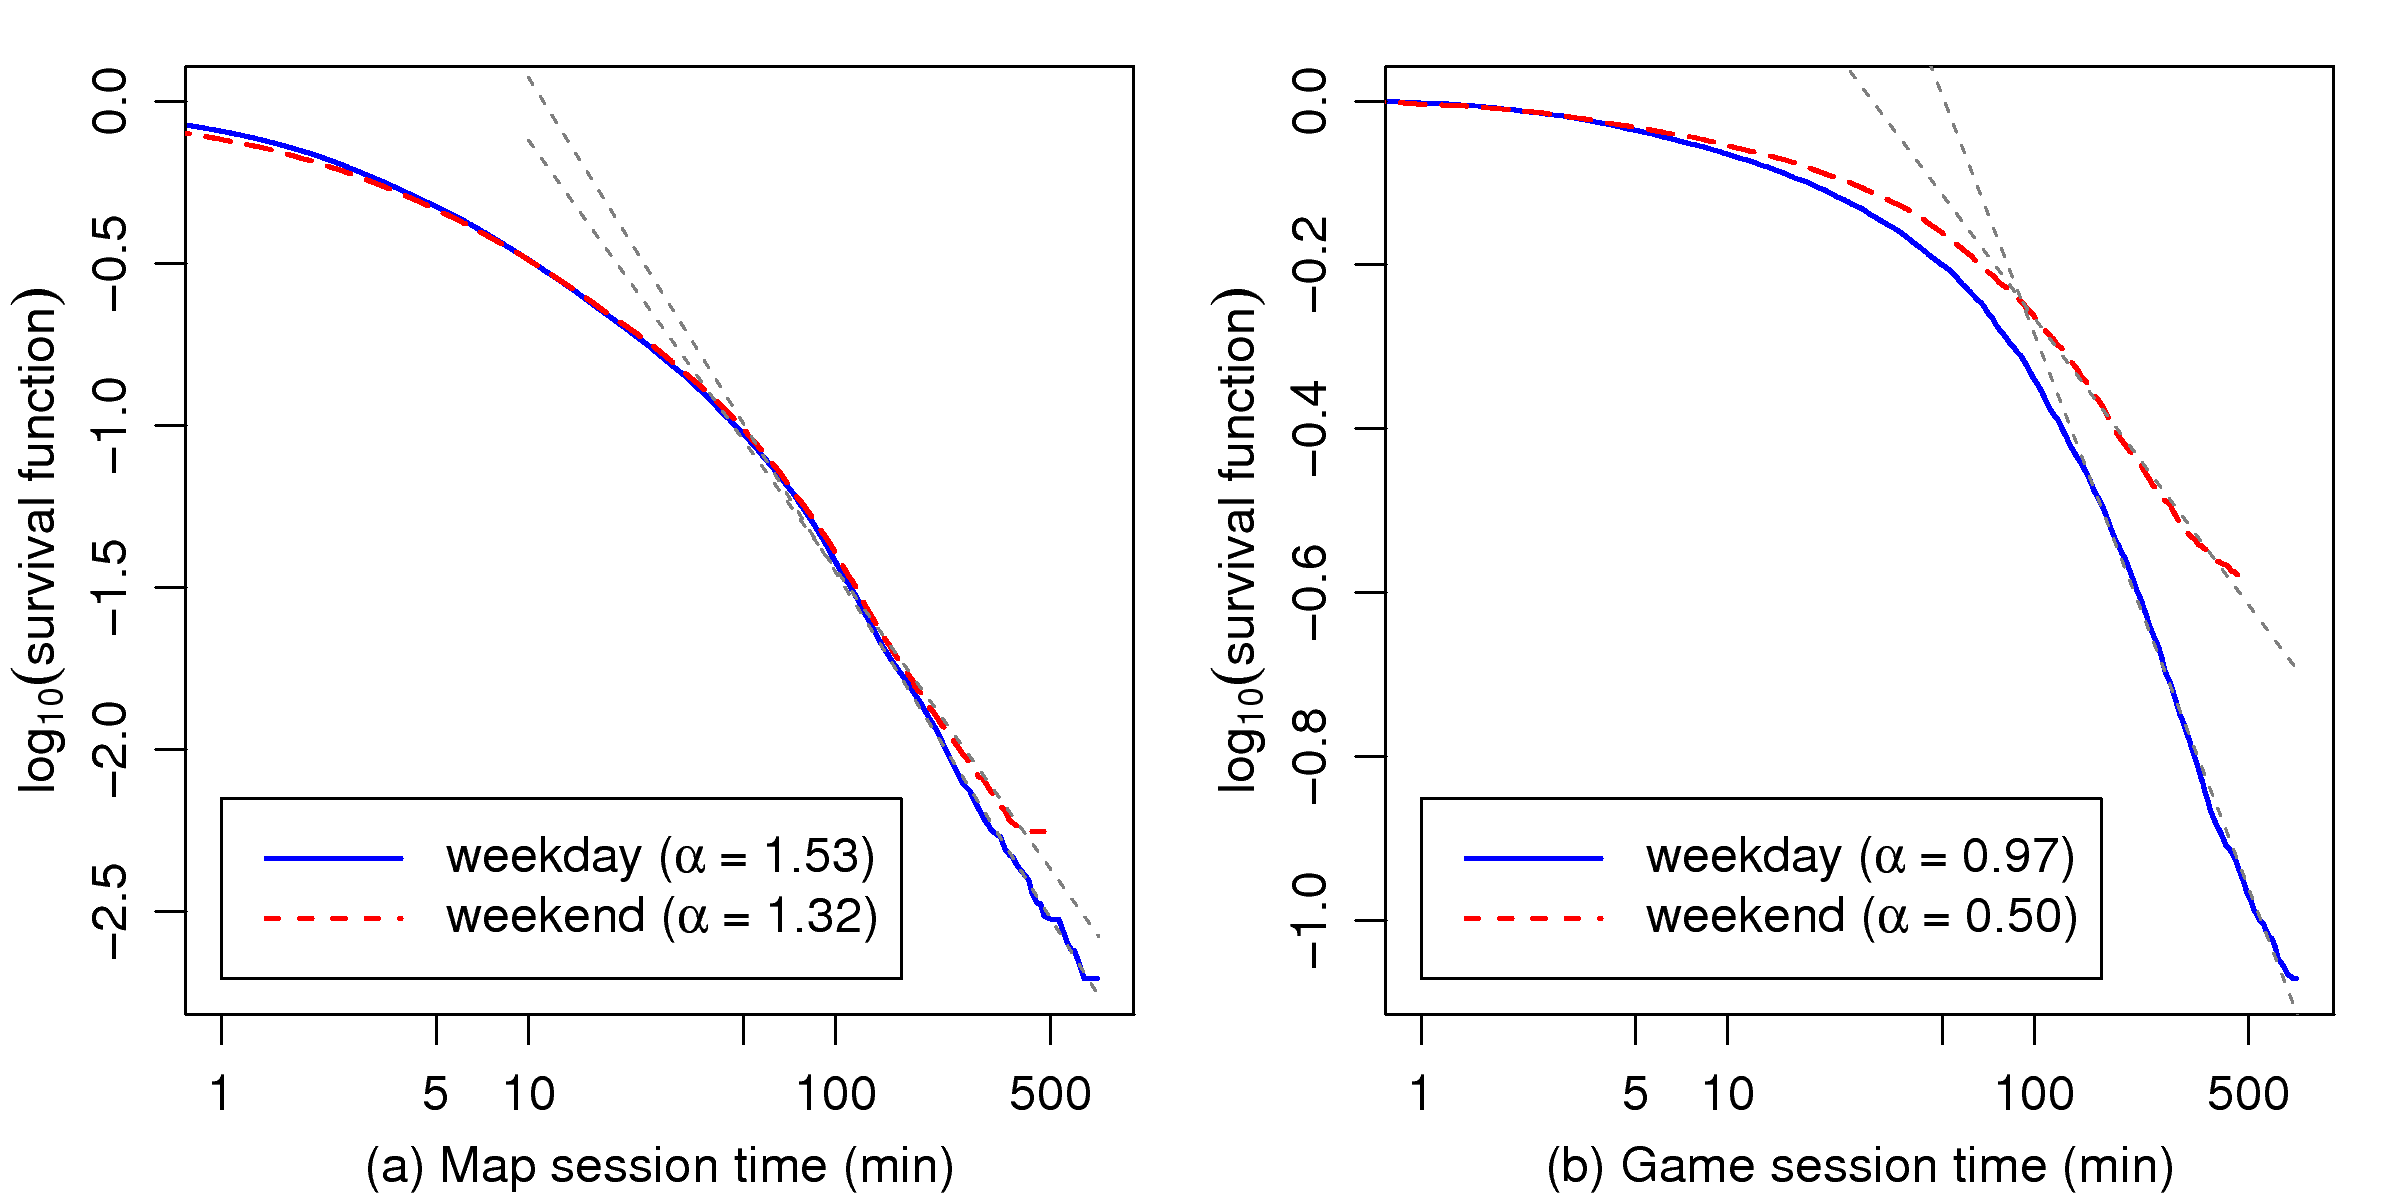
To verify the heavy-tailedness of session times, we plot the
survival functions of the session times on a log-log scale, as shown
in Fig. 24. A simple linear regression of
the tail distributions indicates that 1.3 < alpha < 1.6 for map
sessions and 0.5 < α < 1 for game sessions: both types of session
are heavy-tailed, where game sessions have heavier tails with a
statistically infinite mean, i.e., the expected duration of game
sessions is divergent.
Figure 24: Log-log survival curves for estimating the
tail-heaviness of session duration
The lifetime pattern of the game sessions we observed was very
different from earlier studies for FPS (First-Person Shooting)
games [22,23], in which the
session times were not heavy-tailed. We attribute this discrepancy
to the difference between game genres. FPS games, which are
basically round-based, force players to break off following each
round and give players a chance to regain consciousness of the real
world. On the other hand, the adventures in MMORPGs are continuous
and endless, and no explicit mechanism exists to give players a
pause. The heavy-tailed game sessions can be seen a consequence of
so-called MMORPG addiction. As the Daedalus
Project [24] remarks: "about 50% of MMORPG
players would consider themselves addicted to the games." To
explain the addiction, Yee [24] proposed three main
attraction factors of MMORPGs, namely, the elaborate rewards
cycle, a network of relationships, and the immersive
nature of virtual environments, which encourage time investment and
personal attachment. We believe such factors are the key reasons
that MMORPGs are so popular and also explain the addictive lifetime
pattern of game playing times.
7 Conclusion
In this paper, we have presented an analysis of a packet trace from
ShenZhou Online, a mid-sized commercial MMORPG. The trace reveals that MMORPG
traffic is very different from the traffic of dominant Internet
applications, such as file transfers and web surfing. In summary, we
have identified the following important properties of MMORPG
traffic: 1) tiny packets, 2) periodicity, 3) temporal dependence of
packet arrivals within connections and aggregate traffic, 4)
self-similarity, and 5) heavy-tailed session duration. We have also
offered physical explanations for the observed traffic
characteristics based on the following idiosyncratic user behavior
in MMORPGs: 1) the diversity of user behavior, 2) the clustering
nature of user inputs, 3) the flash crowd effect, 4) the practice of
team play, and 5) heavy-tailed active/idle user activity periods.
With regard to the question of whether or not TCP is suitable for
MMORPGs, we observe a significant amount of overhead from the TCP/IP
header and acknowledgments. The cost is noteworthy: TCP/IP headers
comprise 73% of transmitted bytes, where pure TCP acknowledgement
packets are responsible for 30%. Note that the former includes
the latter.
This suggests that TCP with a sizeable header and positive
acknowledgement mechanism is overkill for applications such as
MMORPGs. The effect of TCP on the end-to-end delay of MMORPGs will
be a good topic for further study.
Acknowledgments
This work would not have been possible without the extensive traffic
trace of ShenZhou Online. The authors are much indebted to the following people
who helped us gather the trace: Tsing-San Cheng, Lawrence Ho,
Chen-Hsi Li, and especially to Yen-Shuo Su, who between them made
the datasets available. The authors also wish to thank Wu-chang Feng
and the anonymous referees for their constructive criticisms of the
preliminary version of this paper [1], which was
presented in NOSSDAV 2005.
References
[1]
K.-T. Chen, P. Huang, C.-Y. Huang, C.-L. Lei, Game Traffic Analysis: An MMORPG Perspective, in: NOSSDAV'05: Proceedings of the International
Workshop on Network and Operating Systems Support for Digital Audio and
Video, ACM Press, 2005, pp. 19-24.
[2]
B. S. Woodcock, An analysis of MMOG subscription growth - version 18.0.
URL http://www.mmogchart.com/">http://www.mmogchart.com/[3]
S. McCreary, K. Claffy, Trends in wide area IP traffic patterns: A view from
Ames Internet exchange, in: Proceedings of 13th ITC Specialist Seminar
on Measurement and Modeling of IP Traffic, 2000, pp. 1-11.
[4]
ShenZhou Online, UserJoy Technology Co., Ltd.
URL http://www.ewsoft.com.tw/">http://www.ewsoft.com.tw/[5]
W. C. Feng, F. Chang, W. C. Feng, J. Walpole, A traffic characterization of
popular on-line games, IEEE/ACM Transactions on Networking 13 (3) (2005)
488-500.
[6]
R. A. Bangun, E. Dutkiewicz, G. J. Anido, An analysis of multi-player network
games traffic, in: Proceedings of the 1999 International Workshop on
Multimedia Signal Processing, Copenhagen, Denmark, 1999, pp. 3-8.
[7]
M. S. Borella, Source models of network game traffic, Computer Communications
23 (4) (2000) 403-410.
[8]
J. Färber, Network game traffic modelling, in: NetGames '02: Proceedings of
the 1st Workshop on Network and System Support for Games, ACM Press, 2002,
pp. 53-57.
[9]
V. Jacobson, C. Leres, S. McCanne, tcpdump (1989).
URL ftp://ftp.ee.lbl.gov[10]
R. Braden, Requirements for Internet Hosts - Communication Layers, RFC 1122
(Standard) (Oct. 1989).
[11]
C. Partridge, P. P. Carvey, E. Burgess, I. Castineyra, T. Clarke, L. Graham,
M. Hathaway, P. Herman, A. King, S. Kohalmi, T. Ma, J. Mcallen, T. Mendez,
W. C. Milliken, R. Pettyjohn, J. Rokosz, J. Seeger, M. Sollins, S. Storch,
B. Tober, G. D. Troxel, A 50-Gb/s IP router, IEEE/ACM Transactions on
Networking 6 (3) (1998) 237-248.
[12]
N. Sheldon, E. Girard, S. Borg, M. Claypool, E. Agu, The effect of latency on
user performance in Warcraft III, in: NetGames '03: Proceedings of the
2nd Workshop on Network and System Support for Games, ACM Press, 2003, pp.
3-14.
[13]
R. Gusella, Characterizing the variability of arrival processes with indexes of
dispersion, IEEE J. Select. Areas Commun. 9 (2).
[14]
P. Danzig, J. Mogul, V. Paxson, M. Schwartz, The Internet Traffic
Archive.
URL http://ita.ee.lbl.gov/">http://ita.ee.lbl.gov/[15]
R. Jain, The Art of Computer Systems Performance Analysis, John Wiley & Son,
Inc., New York, 1991.
[16]
V. Paxson, S. Floyd, Wide area traffic: the failure of Poisson modeling,
IEEE/ACM Transactions on Networking 3 (3) (1995) 226-244.
[17]
W. Willinger, M. S. Taqqu, R. Sherman, D. V. Wilson, Self-similarity through
high-variability: Statistical analysis of Ethernet LAN traffic at the
source level, IEEE ACM Trans. Networking 5 (1) (1997) 71-86.
[18]
P. Abry, D. Veitch, Wavelet analysis of long-range-dependent traffic, IEEE
Trans. Information Theory 44 (1) (1998) 2-15.
[19]
J. Beirlant, A. Guillou, Pareto index estimation under moderate right
censoring, Scandinavian Actuarial Journal 2 (2001) 111-125.
[20]
E. L. Kaplan, P. Meier, Nonparametric estimation from incomplete observations,
Journal of the American Statistical Association 53 (1958) 437-481.
[21]
R. B. D'agostino, M. S. Stephen (Eds.), Goodness-of-Fit Techniques, Marcel
Dekker, New York and Basel, 1986.
[22]
T. Henderson, S. Bhatti, Modelling user behaviour in networked games, in:
MULTIMEDIA '01: Proceedings of the Ninth ACM International Conference on
Multimedia, ACM Press, 2001, pp. 212-220.
[23]
F. Chang, W. chang Feng, Modeling player session times of on-line games, in:
NetGames '03: Proceedings of the 2nd Workshop on Network and System Support
for Games, ACM Press, 2003, pp. 23-26.
[24]
N. Yee, The Daedalus project.
URL http://www.nickyee.com/daedalus">http://www.nickyee.com/daedalus