Smart lenses are detachable lenses connected to mobile devices via wireless
networks, which are not constrained by the small form factor of mobile devices,
and have potential to deliver better photo (video) quality. However, the
viewfinder previews of smart lenses on mobile devices are difficult to optimize,
due to the strict resource constraints on smart lenses and fluctuating wireless
network conditions. In this paper, we design, implement, and evaluate an
open-source smart lens, called Smart Beholder. It achieves three design goals:
(i) cost effectiveness, (ii) low interaction latency, and (iii) high preview
quality by: (i) selecting an embedded system board that is
just powerful enough, (ii) minimizing per-component latency, and (iii)
dynamically adapting the video coding parameters to maximizing Quality of
Experience (QoE), respectively. Several optimization techniques, such as
anti-drifting mechanism for video frames and QoE-driven resolution/frame rate
adaptation algorithm, are proposed in this paper. Our extensive measurement
study indicates that Smart Beholder outperforms Altek Cubic and Sony QX100 in
terms of lower bitrate, lower latency, slightly higher frame rate, and better
preview quality. We also demonstrate that Smart Beholder adapts to network dynamics.
Smart Beholder has been made public as an
experimental platform for researchers and developers for optimized smart lenses,
and other embedded real-time video streaming systems.
1 Introduction
The popularity of smartphones grows dramatically in the past few years,
and the growth rate shows no sign of slowing down. For example, a recent
report [34] indicates that more than 1 billion smartphones were
shipped in 2013, which is equivalent to 38.4% of increase compared to
2012. The smartphones come with cameras, and are used by casual
photographers to replace their digital cameras. In fact, we observe
clear drops on the number of shipped digital cameras starting from 2012,
and the projected shipment volume of digital cameras is only 54 millions
in 2014 [14]. Such replacement effect may be attributed to the
convenience of smartphones and the shrinking performance gap between
smartphone cameras and digital cameras. Nevertheless, there are still
well-known reasons that differentiate digital cameras from smartphone
cameras [1]. First, smartphones must be compact in order to
fit into users' pockets. Therefore, most smartphone cameras are not
equipped with bulky optical zoom lenses. The users have to resort to
suboptimal digital zooms. Second, smartphones often come with smaller
optical sensors due to the space concerns, which lead to inferior photo
quality especially under low-light conditions. Third, smartphones do not
support interchangeable lenses, and cannot adopt long-focus, macro,
fish-eye, and wide-angle lenses for high-quality and more extreme needs.
Last, smartphone cameras are not normally adjustable in terms of, e.g.,
ISO, aperture, and shutter speed, which result in inflexibility. These
limitations prevent mobile photographers from producing
high-quality photos using their smartphones.
Smart lenses, such as Sony QX100 [11], Kodak
SL10 [30], and Altek Cubic [2], are detachable lenses
connected to mobile devices via wireless networks. Mobile photographers
use smartphones (or tablets) to access the smart lenses for: (i)
previewing photos (or videos) in live viewfinders, (ii) adjusting
various lens configurations, (iii) capturing photo (or video) shots, and
(iv) applying digital effects. Since smart lenses are no longer embedded
in smartphones, the form factor of smart lenses are not limited by that of
smartphones. Therefore, smart lenses are capable to address the
aforementioned limitations, closing up the gap of gears between mobile
and professional photographers. Moreover, some special shooting angles,
such as low-angle and close-up shots, are easier to take with smart lenses
as they are detached from viewfinders on smartphones. While smart lenses
offer such new opportunities to mobile photographers, delivering good
photo taking experience is not an easy task because smart lenses
are connected to smartphones via wireless networks, which are sensitive
to fading, shadowing, and interference in wireless communications. In addition,
users have two expectations: (i) low interaction delay and (ii) high graphics
quality, which are contracting to each other for several reasons. For example,
while complex motion estimation algorithms lead to good graphics quality, they
also result in long interaction delay. Last, smart lenses are often implemented
on resource-scarce embedded systems, which further complicate the design,
development, and implementation of smart lenses for diverse applications.
However, existing commercial smart lenses are proprietary and closed, and cannot
facilitate customizations and parameter tuning to exercise the design space.
Figure 1: The working Smart Beholder prototype.
In this paper, we design, implement, and evaluate an open-source smart
lens, called Smart Beholder, or Beholder
for short. The term "beholder" is
normally used to refer a fictional flying orb with a large eye (commonly
seen in AD&D games) [9], in analogy to very
portable smart lenses with powerful (but potentially bulky) optical lenses. We
carefully design and implement Smart Beholder for cost effectiveness, low
interaction delay, and high viewfinder preview quality.
This is done by
(i) selecting an embedded system board that is just powerful enough,
(ii) minimizing per-component latency, and (iii) dynamically adapting
the video coding parameters to maximizing Quality of Experience (QoE),
respectively. Several optimization techniques, such as anti-drifting
mechanism for video frames and QoE-driven resolution/frame rate
adaptation algorithm, are proposed and implemented.
Smart Beholder is built to be an open platform for researchers and developers to evaluate
different design alternatives, so as to make educated, if not optimal, design decisions.
Furthermore, we conduct real experiments to compare the performance of
Smart Beholder and two commercial products [11,2], which are the only
two smart lenses available when we started this project in 2014. Our
experiment results reveal some limitations of the commercial products,
e.g., the preview video quality in viewfinders is low, which leaves
rooms for improvements. Furthermore, we thoroughly evaluate the
performance of a complete Smart Beholder platform as illustrated in
Figure 1. In this picture, the server
runs on a Raspberry Pi board [29] on the left;
the client runs on an Android tablet showing what the webcam on the
server points to. Our evaluation results show the practicality and
efficiency of the Smart Beholder platform over the considered commercial
products.
This paper makes the following contributions:
We present Smart Beholder, an open-source smart lens project, which is
modularized and well documented. Smart Beholder allows researchers, developers, and
amateurs to test their new ideas by either adjusting system settings or
adding/removing components.
We develop, implement, and validate a subjective QoE model to support
preview adaptation for higher overall user experience. Our evaluation results
show that Smart Beholder reduces about 3 Mbps in bitrate and improves at least 0.3
Mean Opinion Score (MOS) in preview quality compared to other commercial products.
We experimentally compare multiple design choices for better performance
and efficiency. The lessons reported in our paper will benefit researchers,
developers, and amateurs who work on smart lenses, e.g., using a hardware encoder
saves at least 86.5 % in energy than using a software encoder.
2 Related Work
Smart lenses are remotely related to mobile photography and
camera sensor networks. Mobile photography refers to using smartphones
for photo taking, which has attracted considerable attentions in several
application domains, such as health care [33] and
ethnography [15]. Existing mobile photography studies rely on
built-in cameras of smartphones, and can be extended by attaching smart
lenses. Camera sensor networks consist of motes with camera sensors and
network interfaces, and transmit captured videos over multi-hop wireless
networks to one or multiple clients [12,36]. Camera sensor
networks focus more on multi-hop routing, while smart lenses support
single-hop transmission of high quality photo (video) to smartphones
(tablets).
Remote screen sharing systems impose similar requirements as smart
lenses: (i) low interaction delay and (ii) high video quality,
but Chang et al. [6] show that earlier screen
sharing systems [4,35,22] fail to
concurrently achieve these two goals. To cope with this limitation,
several companies offer streaming-based cloud gaming
platforms [26,13,32], and multiple research
groups also develop open-source cloud
gaming [19] and screen sharing [5] platforms.
Some platforms adopt adaptive video streaming technology to optimize QoE
under various network conditions [17].
These remote screen sharing
systems are not designed for resource-scarce smart lenses, and they
assume the Internet infrastructure is always available. Our proposed
Smart Beholder platform is, in contrast, tailored for smart lenses.
Although the performance evaluations of smart lenses have never been done,
similar measurement methodologies have been proposed for remote screen
sharing
systems [31,21],
cloud gaming platforms [8,7], and screencast
technologies [16,18]. Nonetheless, the existing
measurement methodologies work on videos captured from the frame buffer,
while the methodology proposed in this paper considers real-time videos
captured from camera sensors.
The measurement methodology is useful in its
own right, e.g., to evaluate the commercial smart lens products which
are proprietary and closed.
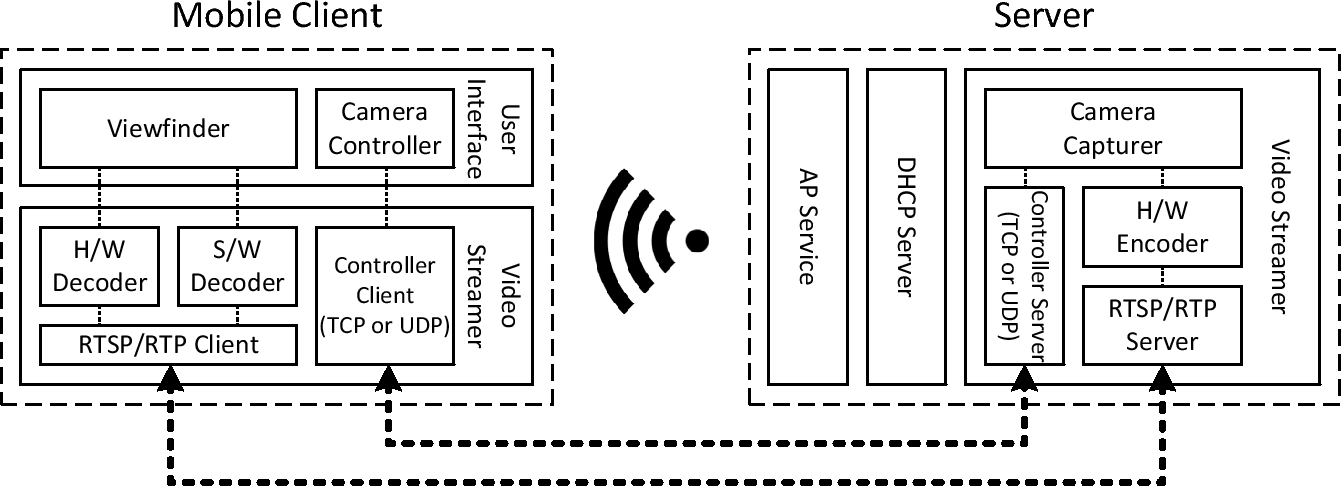
Figure 2: The server and client architecture of Smart Beholder.
Table 1: Candidate Embedded System Boards
Arduino
Raspberry Pi (B)
UDOO
BeagleBoard
Pandaboard
Jetson TK1
ATmegaAVR,
ARM1176JZF-S
ARM Cortex-A9,
ARM Cortex-A8
ARM Cortex-A9
ARM Cortex A15
ARM Cortex-M3
ARM Cortex-M3/M4
GPU
None
Broadcom VideoCore IV
Integrated graphics
PowerVR SGX530
SGX540 graphics
192 SM3.2 CUDA cores
I/O port
Regular USB
USB 2.0
USB 2.0
USB 2.0
USB 2.0
USB 3.0
HW encoder
None
H.264
H.264
H.264, MPEG4
H.264, MPEG4
H.264, VC-1, VP8
Memory
16 - 512 KB
512 MB
512 MB - 1 GB
256 - 512 MB
1 GB
2 GB
Price
$13 - $60
$35
$135
$49 - $149
$174 - $182
$192
Camera module
Yes
Yes
Yes
Yes
Yes
No
Smart Beholder is released with two types of software
packs: all-in-one and pre-compiled binary packs. In addition, the source codes
and complete documents are available on our project
website at ">http://www.smartbeholder.org">http://www.smartbeholder.org. Users may extend Smart Beholder to
support other hardware platforms running embedded Linux.
Banana Pi-D1 [3] is an open IP camera project based on a different embedded system board.
Compared to Banana Pi-D1, Smart Beholder has been optimized by solving various research
problems described in the paper, e.g., constructing QoE model for preview adaptation,
and minimizing latency by reducing memory copies. These optimization techniques can also be applied
to Banana Pi-D1 and other similar projects.
3 Proposed System Architecture
The server and client architecture of the proposed Smart Beholder is given in
Figure 2. Smart Beholder is inspired by cloud gaming and screen
sharing platforms [19,5], but concentrates on solving the
unique challenges of smart lenses, including (i) resource constraints of
embedded system boards, (ii) uncertainty of single-hop short-range
networks, and (iii) high overhead of external camera modules. The
Smart Beholder server runs on an embedded system board, and consists of three
software components: AP (Access Point) service, DHCP (Dynamic Host
Configuration Protocol) server, and video streamer. The AP service turns
the server into an access point, allowing Smart Beholder clients to connect to
the server via Wi-Fi (or other wireless networks). The DHCP server
assigns IP addresses to connected mobile clients. Meanwhile, the video
streamer: (i) captures videos using a camera, (ii) encodes
videos using software/hardware codecs, and (iii) streams encoded videos
via the RTSP (Real-Time Streaming Protocol) and RTP (Real-Time
Protocol) servers.
The Smart Beholder client runs on mobile devices and consists of two
components: UI (User Interface) and video streamer. The UI component is
composed of the viewfinder and camera controller. The viewfinder renders
the live videos received from the Smart Beholder server, and the camera
controller sends camera control commands to the server. Possible camera
control commands include taking photo, recording video, setting white
balance, applying image effects, configuring exposure, and tuning
sensitivity. The video streamer contains hardware/software decoders,
controller client, and RTSP/RTP client.
4 Design Objectives
Smart Beholder aims to provide an open platform for researchers and developers to
study and build real-time mobile photography applications. The design
objectives of the proposed Smart Beholder platform include:
Cost effectiveness.
To allow more
researchers and developers to use Smart Beholder, we carefully
select more cost-effective hardware components. Users are, however,
free to swap in/out any of the components to meet their needs.
Low latency. Users will be annoyed by long latency when
using mobile photography applications, especially in viewfinder
previews. To provide better photo taking experience, we strive to
minimize latencies of all components.
High quality. A fundamental requirement for
photography is maximizing the photo (video) quality. The photo
(video) quality largely depends on the hardware specifications of
camera components, which are out of the scope of this work. On the
other hand, sending live previews (for both photo and video shots)
incurs a huge amount of real-time traffic, and thus leaves more
rooms for optimization. Indeed, the quality of live previews
significantly affects how a photographer sees and composes photos,
especially for portraits and close-up shots. Hence, for higher QoE,
we endeavor to maximize the preview video quality.
We emphasize that concurrently achieving all design goals is no easy
task. For example, we have to optimize individual components in the
video processing pipeline to minimize the system-wide latency. In
addition, we need to consider multiple user-perceived quality metrics,
such as graphics quality and interactivity, which further complicates
the design of Smart Beholder. We present our approaches to achieve the
design goals in the next few sections.
5 Hardware Platform
We present the options of main hardware components, and
our design decisions.
5.1 Embedded System Boards
Table 1 summarizes the candidate boards. While Arduino is
the least expensive board, it does not have enough resources (such as
memory) to host Linux OS. This significantly increases the
implementation complexity. Moreover, Arduino is not equipped with GPU,
which is dictated by real-time video encoding. Hence, we adopt Raspberry Pi,
which has a GPU and supports Linux OS and is just powerful enough for Smart Beholder.
5.2 Camera Modules
There are two ways to attach cameras to Raspberry Pi: USB and Camera
Serial Interface (CSI). We have experimentally integrated cameras via
both interfaces, as detailed below. We adopt Video4Linux API to
access USB cameras. The API supports UVC (USB Video Class) compatible
cameras [25]. The slower read system call supports all
UVC cameras, while the more efficient mmap system call only
supports some UVC cameras. Modern webcams like Logitech C525 are
supported by mmap, but many of them can only capture raw video
frames in YUYV (YUV422) format. The YUYV frames are not
supported by some encoders, and have to be converted into YUV420 format.
We find that Raspberry Pi only achieves 6 to 9 fps (frame per second) at 720p resolution.
Hence, USB cameras are less suitable for live previews. CSI cameras, such
as Omnivision OV5647, support Video4Linux and OpenMAX IL.
Different from user-space Video4Linux, OpenMAX IL abstracts
a set of multimedia hardware components for developers to use in an
efficient way. Therefore, we employ OpenMAX IL to access CSI
cameras. Doing so increases the 720p frame rate to 15 fps, which is
still lower than acceptable. A closer look indicates that such inferior
frame rate is partially due to expensive (and redundant) memory copies,
which are further optimized in Section 6.2.
6 Software Design Decisions
We minimize the latency of several software
components, to minimize the overall latency.
6.1 Hardware Encoder
To reduce the encoding latency, we leverage Raspberry Pi's H.264
hardware encoder via OpenMAX IL. This encoder supports various
configuration options, and we exercise the following options: profile,
bitrate, frame-rate, GoP size, and B frames. One minor issue of
Raspberry Pi's hardware encoder is lack of mechanisms to retrieve the
SPS (Sequence Parameter Set) and PPS (Picture Parameter Set) parameters
associated with an encoder, which are mandatory for correctly setting up
the RTSP/RTP server. To cope with this limitation, we first initialize
the hardware encoder with a set of parameters P, use it to encode some
dummy frames, and then retrieve the SPS and PPS parameters from the
encoded video frames. We use those retrieved SPS and PPS parameters to
setup the RTSP/RTP server. Next, we re-initialize the encoder with the
same set of parameters P in order to ensure that encoded video frames
have identical SPS and PPS parameters with the RTSP/RTP server. This
allows us to use hardware encoder for lower latency.
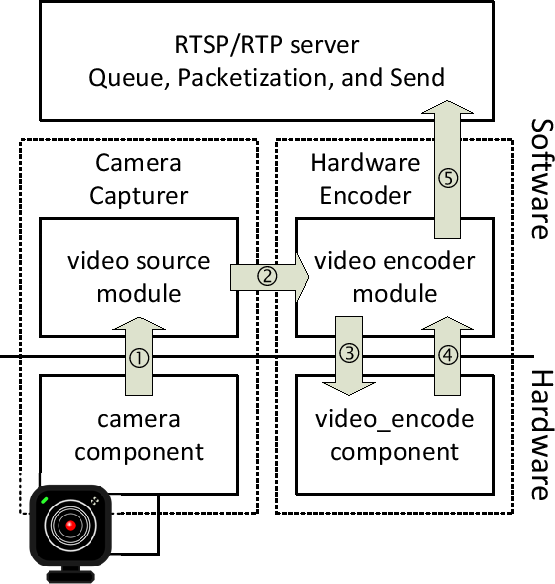
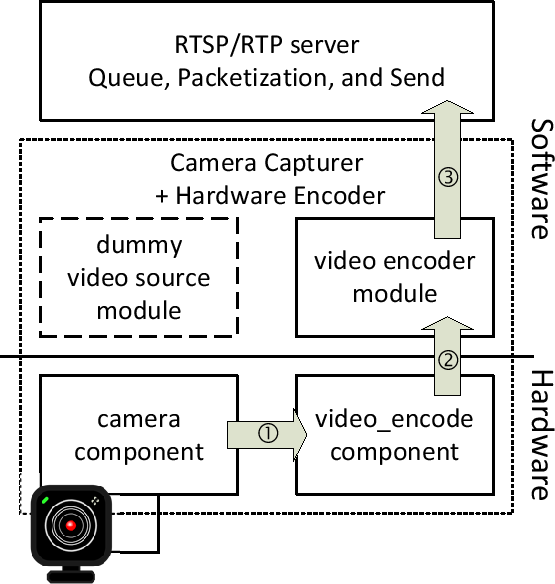
6.2 Reduce the Number of Memory Copies
Figure 3(a) presents the software components
that are not optimized for low latency. The camera capturer and hardware
encoder both span over software and hardware, and thus several memory
copies, such as arrows 1 and 3, incur unnecessary overhead. We propose
an optimized design in Figure 3(b), which
directly passes raw video frames from camera to hardware encoder. By
doing so, we significantly increase the capture and encoding rates to 60
fps at 720p and 30 fps at 1080p. This leads to much smoother previews
and shorter latency. In addition, the optimized server components are
simpler and easier to implement.
(a)
(b)
Figure 3: Server software components: (a) unoptimized and (b) optimized.
6.3 Software Decoder
We have experimentally implemented both software and hardware decoders.
Intuitively, hardware decoders run faster than software ones. However,
our experiments using Android's MediaCodec framework to access
hardware decoders on several Sony/HTC mobile devices incur an additional
delay between 80 and 100 ms, which is independent to frame resolutions.
Some preliminary tests indicate that official Java-based hardware
decoder APIs always buffer a couple of frames. The buffer size, however,
is not configurable via MediaCodec framework. Therefore, we adopt
ffmpeg software decoder, which achieves 24 fps at 720x480. This is
sufficient for live preview on mobile clients. By adopting software
decoders, we have full control over the decoding and buffering mechanisms.
For minimum delay, we decode a frame whenever we see an end-of-frame
mark; consequently, we achieve a ≤ 10 ms buffering time unless the
network condition is highly unstable. Currently we adopt the software
decoder for shorter latency, but future Smart Beholder may switch to hardware
decoders if the extra buffering time can be controlled and eliminated.
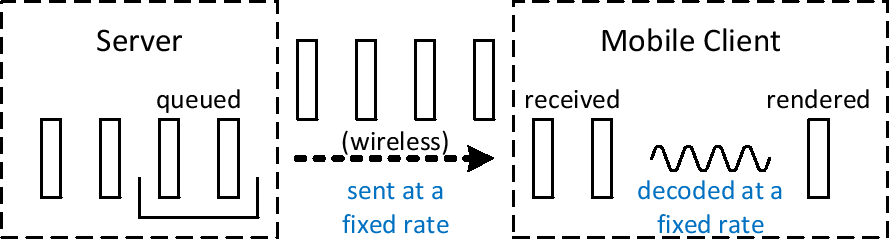
(a) Good network condition.
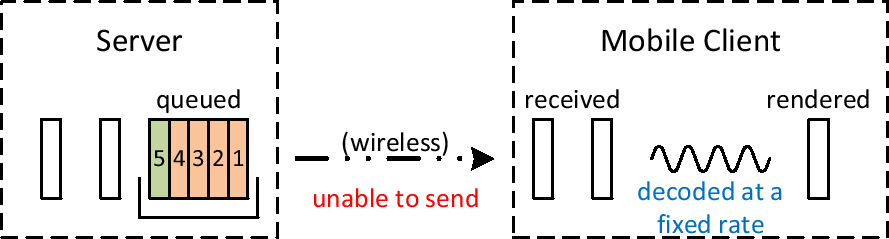
(b) Bad wireless network condition.
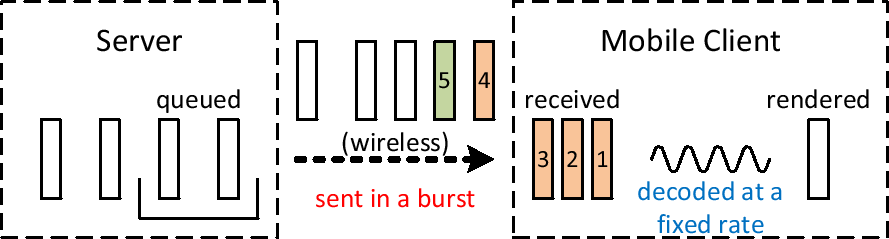
(c) Recovered from bad wireless network condition.
Figure 4: An illustrative example of time-drifted video frames.
6.4 Time-Drifted Video Frames
Our early experiments indicate that playout times of video frames may be
drifted. Figure 4 presents an example that causes
time-drifted video frames. When network condition is good
(Figure 4(a)), server sends video frames at a
fixed rate, and mobile client renders video frames at the same rate.
When network transmission is stalled due to weak signals or wireless
interference (Figure 4(b)), video frames are
queued on the server (at IP or MAC layer). Once network condition
is recovered (Figure 4(c)), queued video frames are
sent in a burst. The decoder at mobile client may fail to keep up with
bursty video frames, and renders some video frames too late. This
results in time-drifted video frames.
We propose to drop late video frames at mobile clients to address this
issue. For this purpose, we attach two timestamps with each video frame:
(i) receiving time at client and (ii) sending time at server. For frame
i, we denote the receiving timestamp as tri and sending timestamp
as tsi, and the time offsets as δtri = tri − tr1 and
δtsi = tsi − ts1. The frame delay is ∆fi = δ tri − δtsi. We drop a frame i iff ∆fi > L, where
L is a user-configurable threshold. L typically is in the order of
tenth of ms, and we use 50 ms if not otherwise specified.
7 Adaptive Live Preview
We develop empirical models and then propose an
efficient adaptation algorithm to dynamically maximize the QoE of live
previews.
7.1 Single-Hop Wi-Fi Network Model
Estimating available bandwidth of an ongoing live preview session is
extremely challenging, although several attempts have been made in
wired [28,20] and wireless [24] networks. These
approaches send extra probing packets, which incur additional
overhead on the already tight network resources. In contrast, we develop
a customized network model to leverage existing video packets for
estimating the available bandwidth.
Our core idea, inspired by WBest [24], is to keep track of the
size and receiving timestamp of packet p as sp and trp. We then
compute the dispersion time of every pair of adjacent packets (belonging
to the same video frame), and estimate the instantaneous capacity cp
as cp = sp−1 / (trp − trp−1). We can use video packets as
probing packets, because: (i) Smart Beholder server sends a video frame every
33 ms (assuming a 30-fps configuration), and thus the instantaneous
sending bitrate is much higher than the coding bitrate; and (ii) each
video frame is composed of several back-to-back packets due to the
limited network MSS (Maximum Segment Size). Furthermore, the single-hop
Wi-Fi network is dedicated to Smart Beholder, and thus the available bandwidth
is the same as estimated capacity.
Our initial experiments indicate that cp fluctuates quite a bit.
Therefore, we adopt a sliding window of W+1 packets for de-noising.
This is similar to prior studies [24,28,20], which
employ diverse aggregation approaches, such as mean, medium, and
maximum. To be more general and adaptive, we sort all instantaneous
capacity values within sliding window (packets cp−W, cp−W+1,..., cp) in the increasing order. We let [ˉc]αp be the
α-percentile capacity, and use it to estimate the network
capacity (available bandwidth).
We have instructed Smart Beholder and conducted experiments to determine the best
W and α parameters to better match the estimated capacity with
the ground truth given by (intrusive) tools, like iperf. We place
the sender and client in a hallway, and vary the distance between them
between 1 and 40 meters. We measure the network capacity using Smart Beholder
and iperf at each distance for 1 minute. We then derive the best
α parameter based on the ground truth. We first vary the sliding
windows size W = { 375, 750, 1500, 3000} and repeat the experiments
5 times to check the consistency of the best α parameters. We
compute the variance of α and find that the variance becomes
negligible (at most 8 ×10⁻⁴) with W=3000. Hence, we set W
to be 3000.
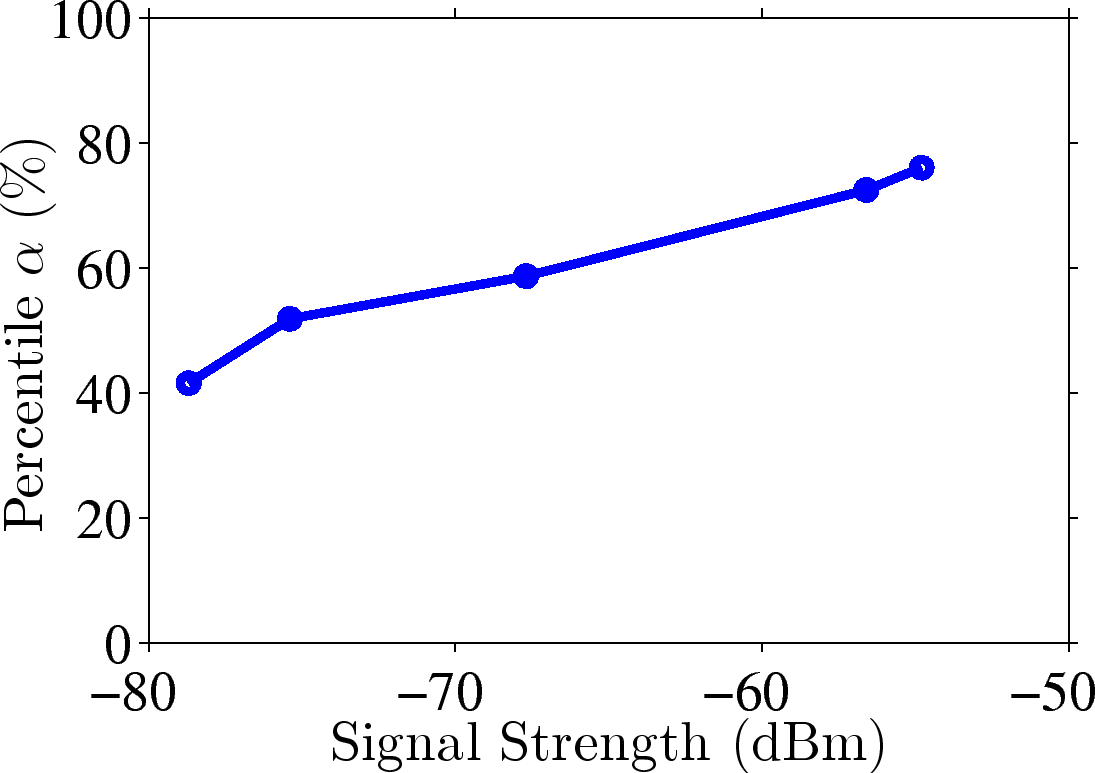
In our experiments, we find that α parameter depends on the
signal strength, denoted as g, of Wi-Fi. Most OS's, including
Android, constantly report Wi-Fi signal strength in dBm, which may be
readily used by our adaptation algorithm. Therefore, we conduct
additional experiments and log the g values, in order to model
α as a function of g. The empirical results reveals that
α can be modeled as a piecewise linear function [23] as
illustrated in Figure 5. Using adaptive α
parameters allow us to better approximate the ground truth from
iperf without the excessive network overhead. Last, we note that,
currently α values are derived offline, while online training of
α is also possible.
Figure 5: Piecewise linear model of α.
7.2 Quality of Experience Model
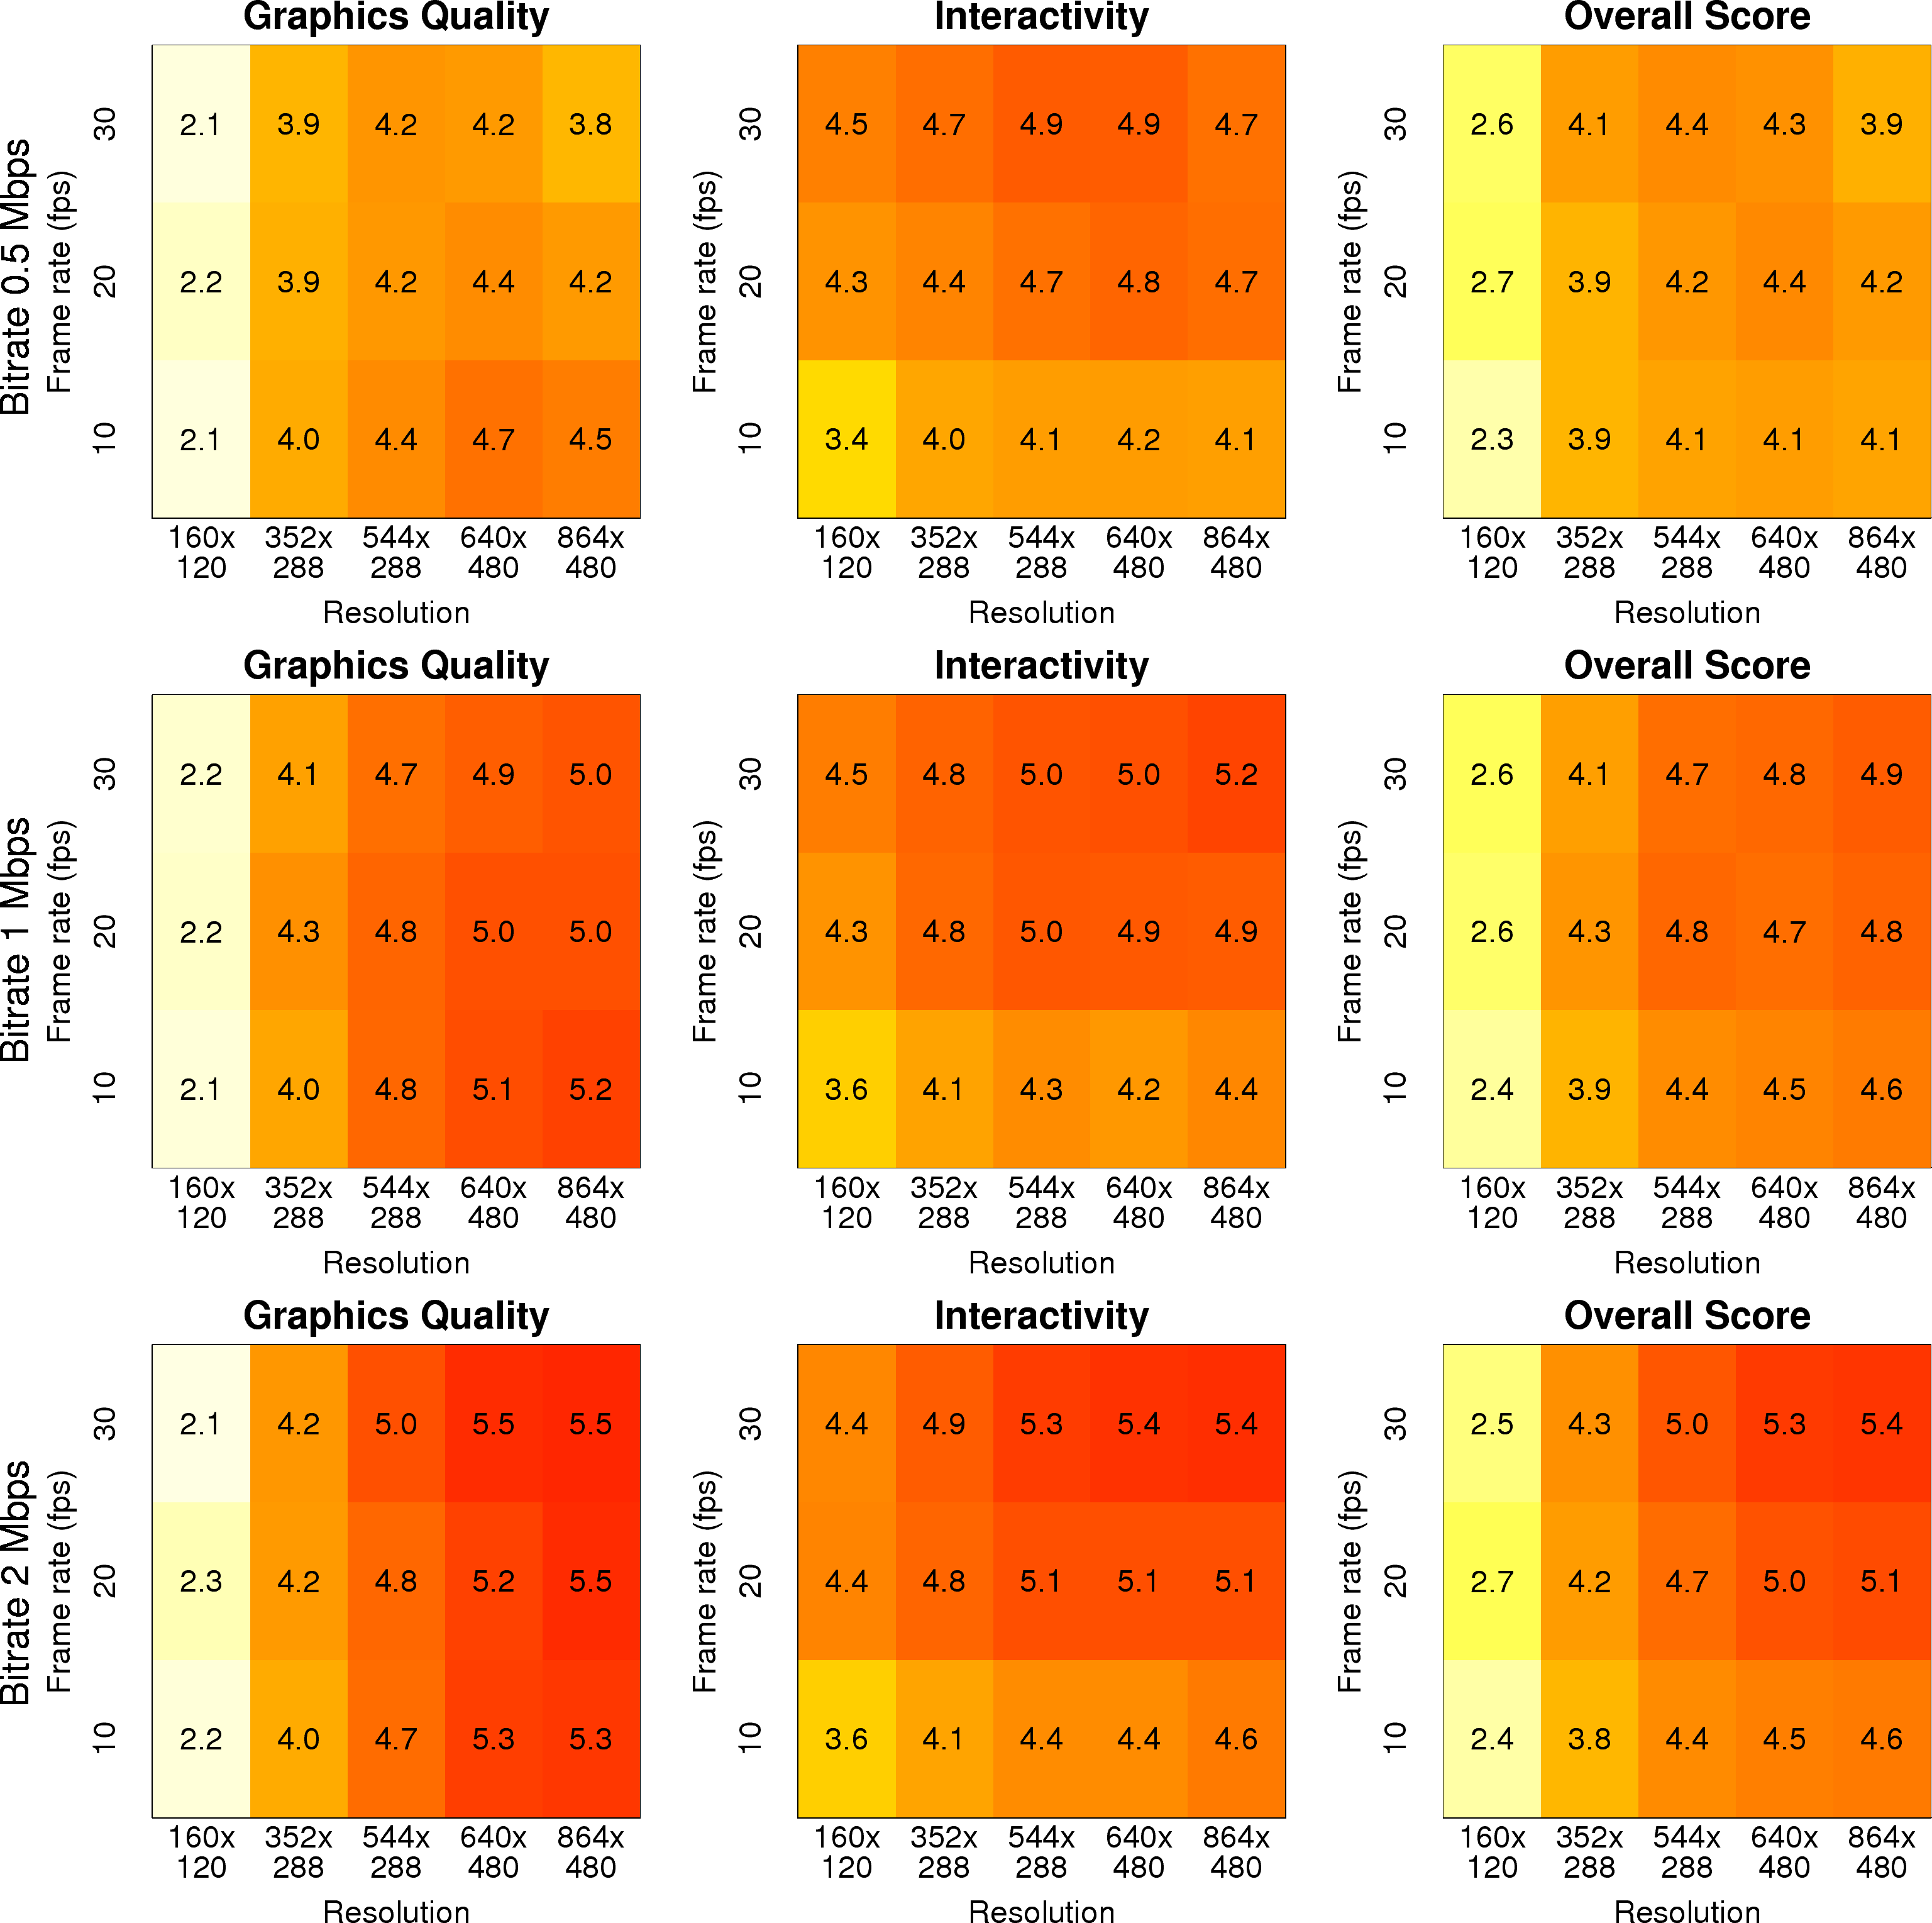
Figure 6: Mean MOS scores from a Smart Beholder testbed.
Smart Beholder supports dynamic adjustments of bitrate b, frame rate f, and
resolution r of viewfinder previews on-the-fly. However, determining
these encoding parameters for high QoE is challenging, and therefore we
conduct a user study to derive the model for our adaptation algorithm as
follows. We run the sever on a Raspberry Pi and the client on an Xperia
tablet in our lab. We vary the encoding configurations in terms of
bitrate b = {0.5, 1, 2} Mbps, frame rate f = {10, 20, 30} fps,
and resolution r = {160x120, 352x288, 544x288, 640x480, 864x480}.
We recruit subjects on campus and online for the user study. Each
subject has at most 3 minutes to use Smart Beholder under each configuration. For
each configuration, a subject gives three quality scores between 1
(worst) and 7 (best) on: (i) graphics quality, (ii) interactivity, and
(iii) overall satisfaction. Subjects are free to terminate 3-minute
experiments earlier. We have 30 subjects (63% male) and perform 89
sessions (45 rounds per session) in total. Each session lasts for 31
minutes on average, and the total user study time is almost 46 hours.
We made two observations on the overall MOS scores
given in Figure 6. First, when the
bitrate is ≥ 1 Mbps, higher frame rates and resolutions lead to
higher MOS scores. Second, when the bitrate is lower (0.5 Mbps), higher
resolutions (such as 864x480) may result in lower MOS scores (than,
e.g., 544x288). These two observations show the importance of the QoE
model because higher bitrates, frame rates, and resolutions do not
guarantee better QoE. Based on
Figure 6, we let Qb be
the overall MOS table at bitrate b, and qb(f,r) be the MOS
score at b, f, and r. Qb table is given in the figure
if b ∈ {0.5, 1, 2}, but is interpolated/extrapolated otherwise.
Then, to get qb(f,r) we look up table Qb with potential
interpolation/extrapolation as well. The presented QoE model enables us
to pick the encoding parameters for optimal user experience.
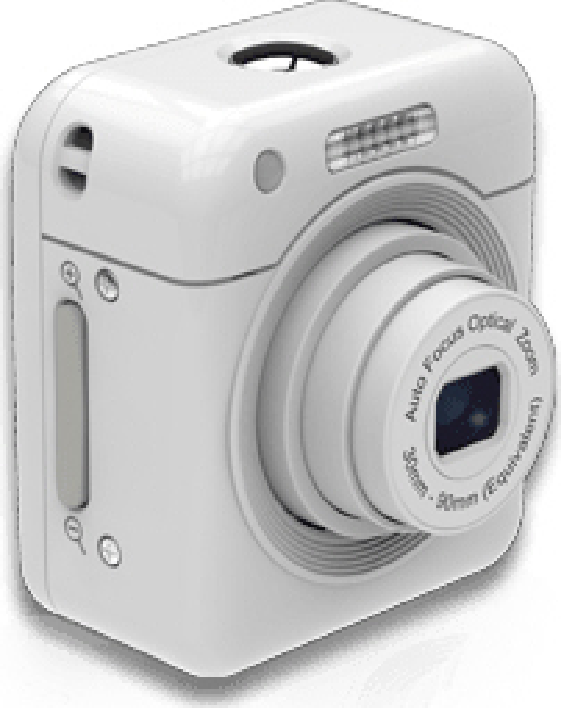
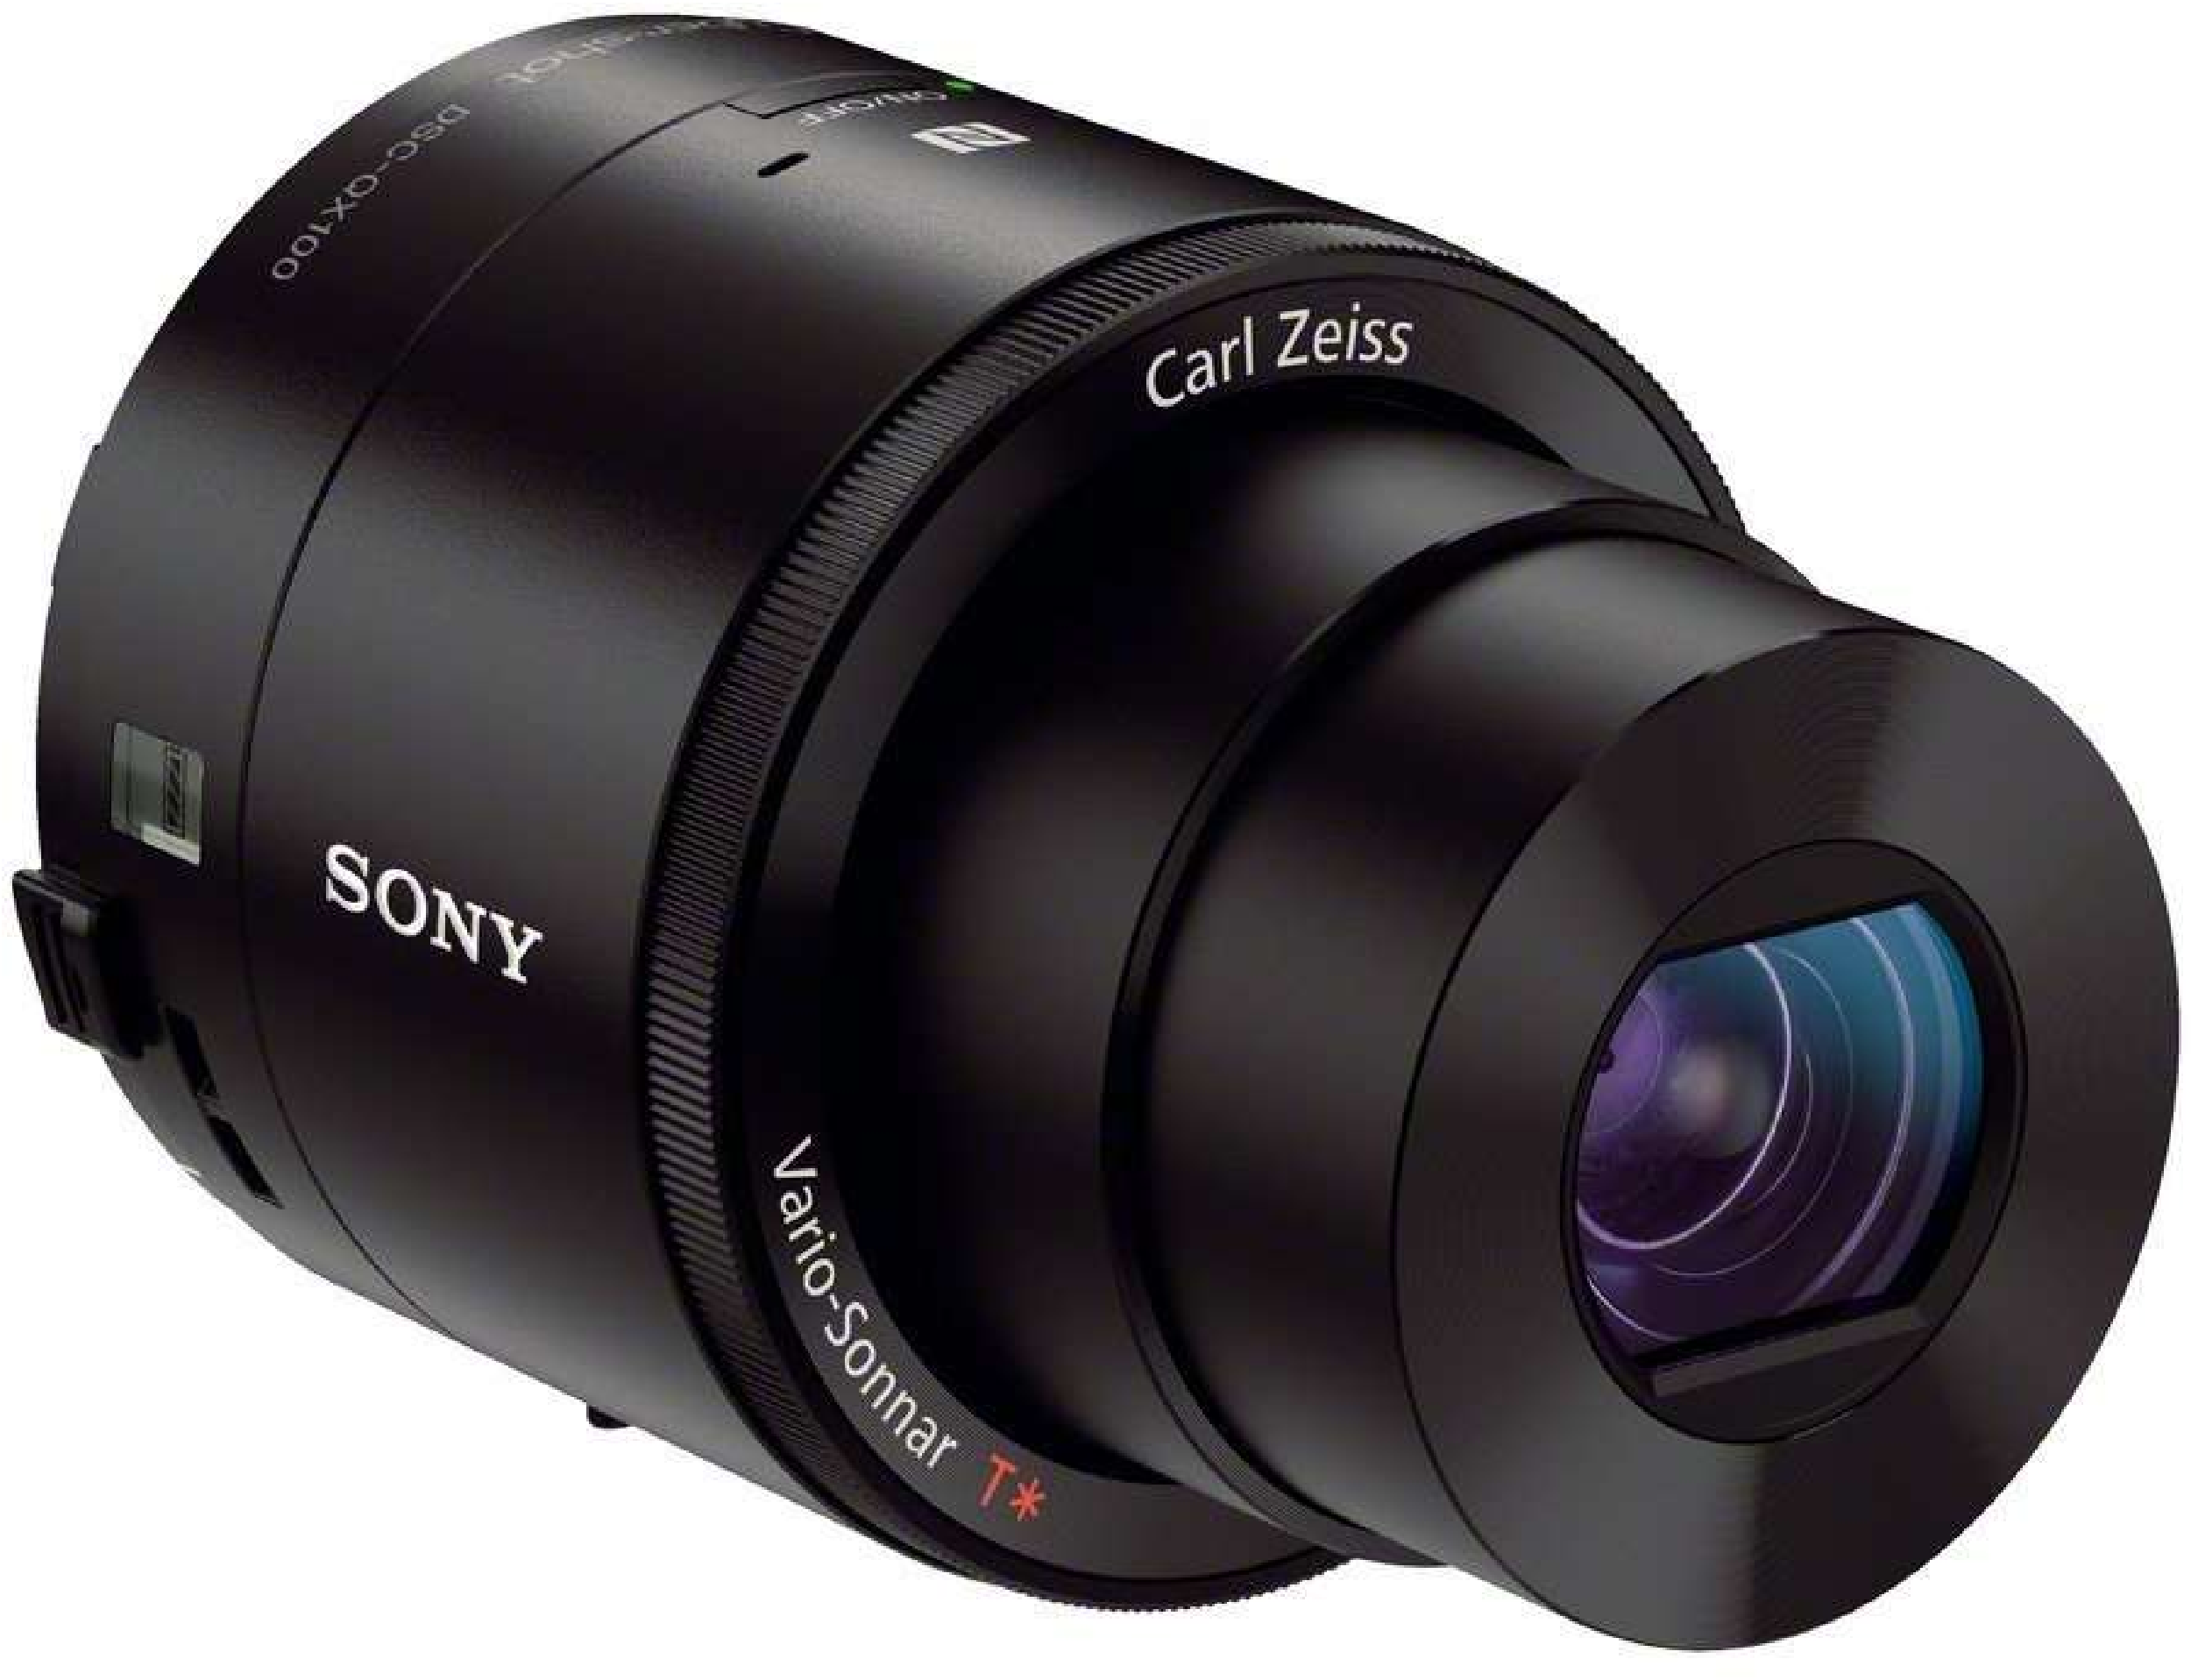
Figure 7: Photos of the considered smart lenses: Smart Beholder (left), Altek Cubic
(middle), and Sony QX100 (right).
7.3 Preview Adaptation Algorithm
We develop an efficient algorithm to dynamically adjust the encoding
parameters, in order to avoid QoE degradation due to network impairments
such as insufficient bandwidth and high packet loss rate. The algorithm
runs periodically, evaluating available bandwidth [ˉc]αp
(using the network model developed above) and packet loss rate ρ on
mobile client once every T seconds. T is a system parameter, which
is set to 10 seconds by default. [ˉc]αp and ρ are sent
back to the server to make decisions on encoding parameters based on
four other system parameters: minimum loss rate ρl, maximum loss
rate ρh, bitrate increment step δi, and bitrate
restoration factor γr. If not otherwise specified, we set
ρl = 5%, ρh = 20%, δi = 0.2, and γr = 0.7.
[tb]
[1]
every T seconds
Compute [ˉc]αp and ρ
b < [ˉc]αp and ρ < ρl
b = b + ([ˉc]αp − b ) ×δi
b > [ˉc]αp or ρ > ρh
b = γr ×[ˉc]αp
Given b, lookup qb (f*, r*) for the highest MOS score
Reconfigure video encoder with b, f*, r*
#1Preview Adaptation Algorithm
Algorithm 1 gives the pseudocode of our algorithm.
Line 3 checks whether our encoding bitrate is lower than available
bandwidth1 and packet
loss rate is low; if it passes, line 4 increases encoding bitrate. Lines
5 and 6 are similar, but to reduce encoding bitrate by setting it to a
certain ratio (i.e., γr) times the measured available bandwidth.
At line 7, we know the target encoding bitrate b, and employ the QoE
model to get the best f* and r*. Line 9 reconfigures the video
encoder. It is easy to see that our preview adaptation algorithm runs in
constant time at the server. At the mobile client, sorting instantaneous
capacity values when deriving [ˉc]αp dominates the time
complexity, which is O(W logW). Given that W is at most a few
thousands, the computation complexity is relatively negligible to modern
smartphones.
Table 2: Average Accuracy of Capacity Measured by Beholder
Distance
1.25 m
2.5 m
5 m
10 m
20 m
Beholder
44.89 Mbps
39.33 Mbps
33.76 Mbps
31.29 Mbps
10.02 Mbps
iperf
39.47 Mbps
36.22 Mbps
31.77 Mbps
29.38 Mbps
10.06 Mbps
Deviation
13.7 %
8.5 %
6.3 %
6.5 %
0.4 %
Last, we evaluate the accuracy of the proposed adaptation algorithm by
separating the server and client by 1.25, 2.5, 5, 10, and 20 meters. We use
Smart Beholder and iperf to measure the network capacity for 1 minute at each
distance, and repeat the experiments 5 times. Table 2
summarizes the estimated capacity from Smart Beholder and iperf. This table
shows that Smart Beholder achieves very small deviation compared to the ground truth from
iperf. The deviation is higher under shorter distances, which however is not a
big issue because the available bandwidth is sufficient (e.g., ∼ 40 Mbps
at 1.25 m) for all practical frame rates and resolutions.
8 Performance Evaluation
We conduct real experiments to compare
Smart Beholder against commercial smart lenses.
Figure 8: Experiment setup for inferring the preview resolutions of
commercial smart lenses.
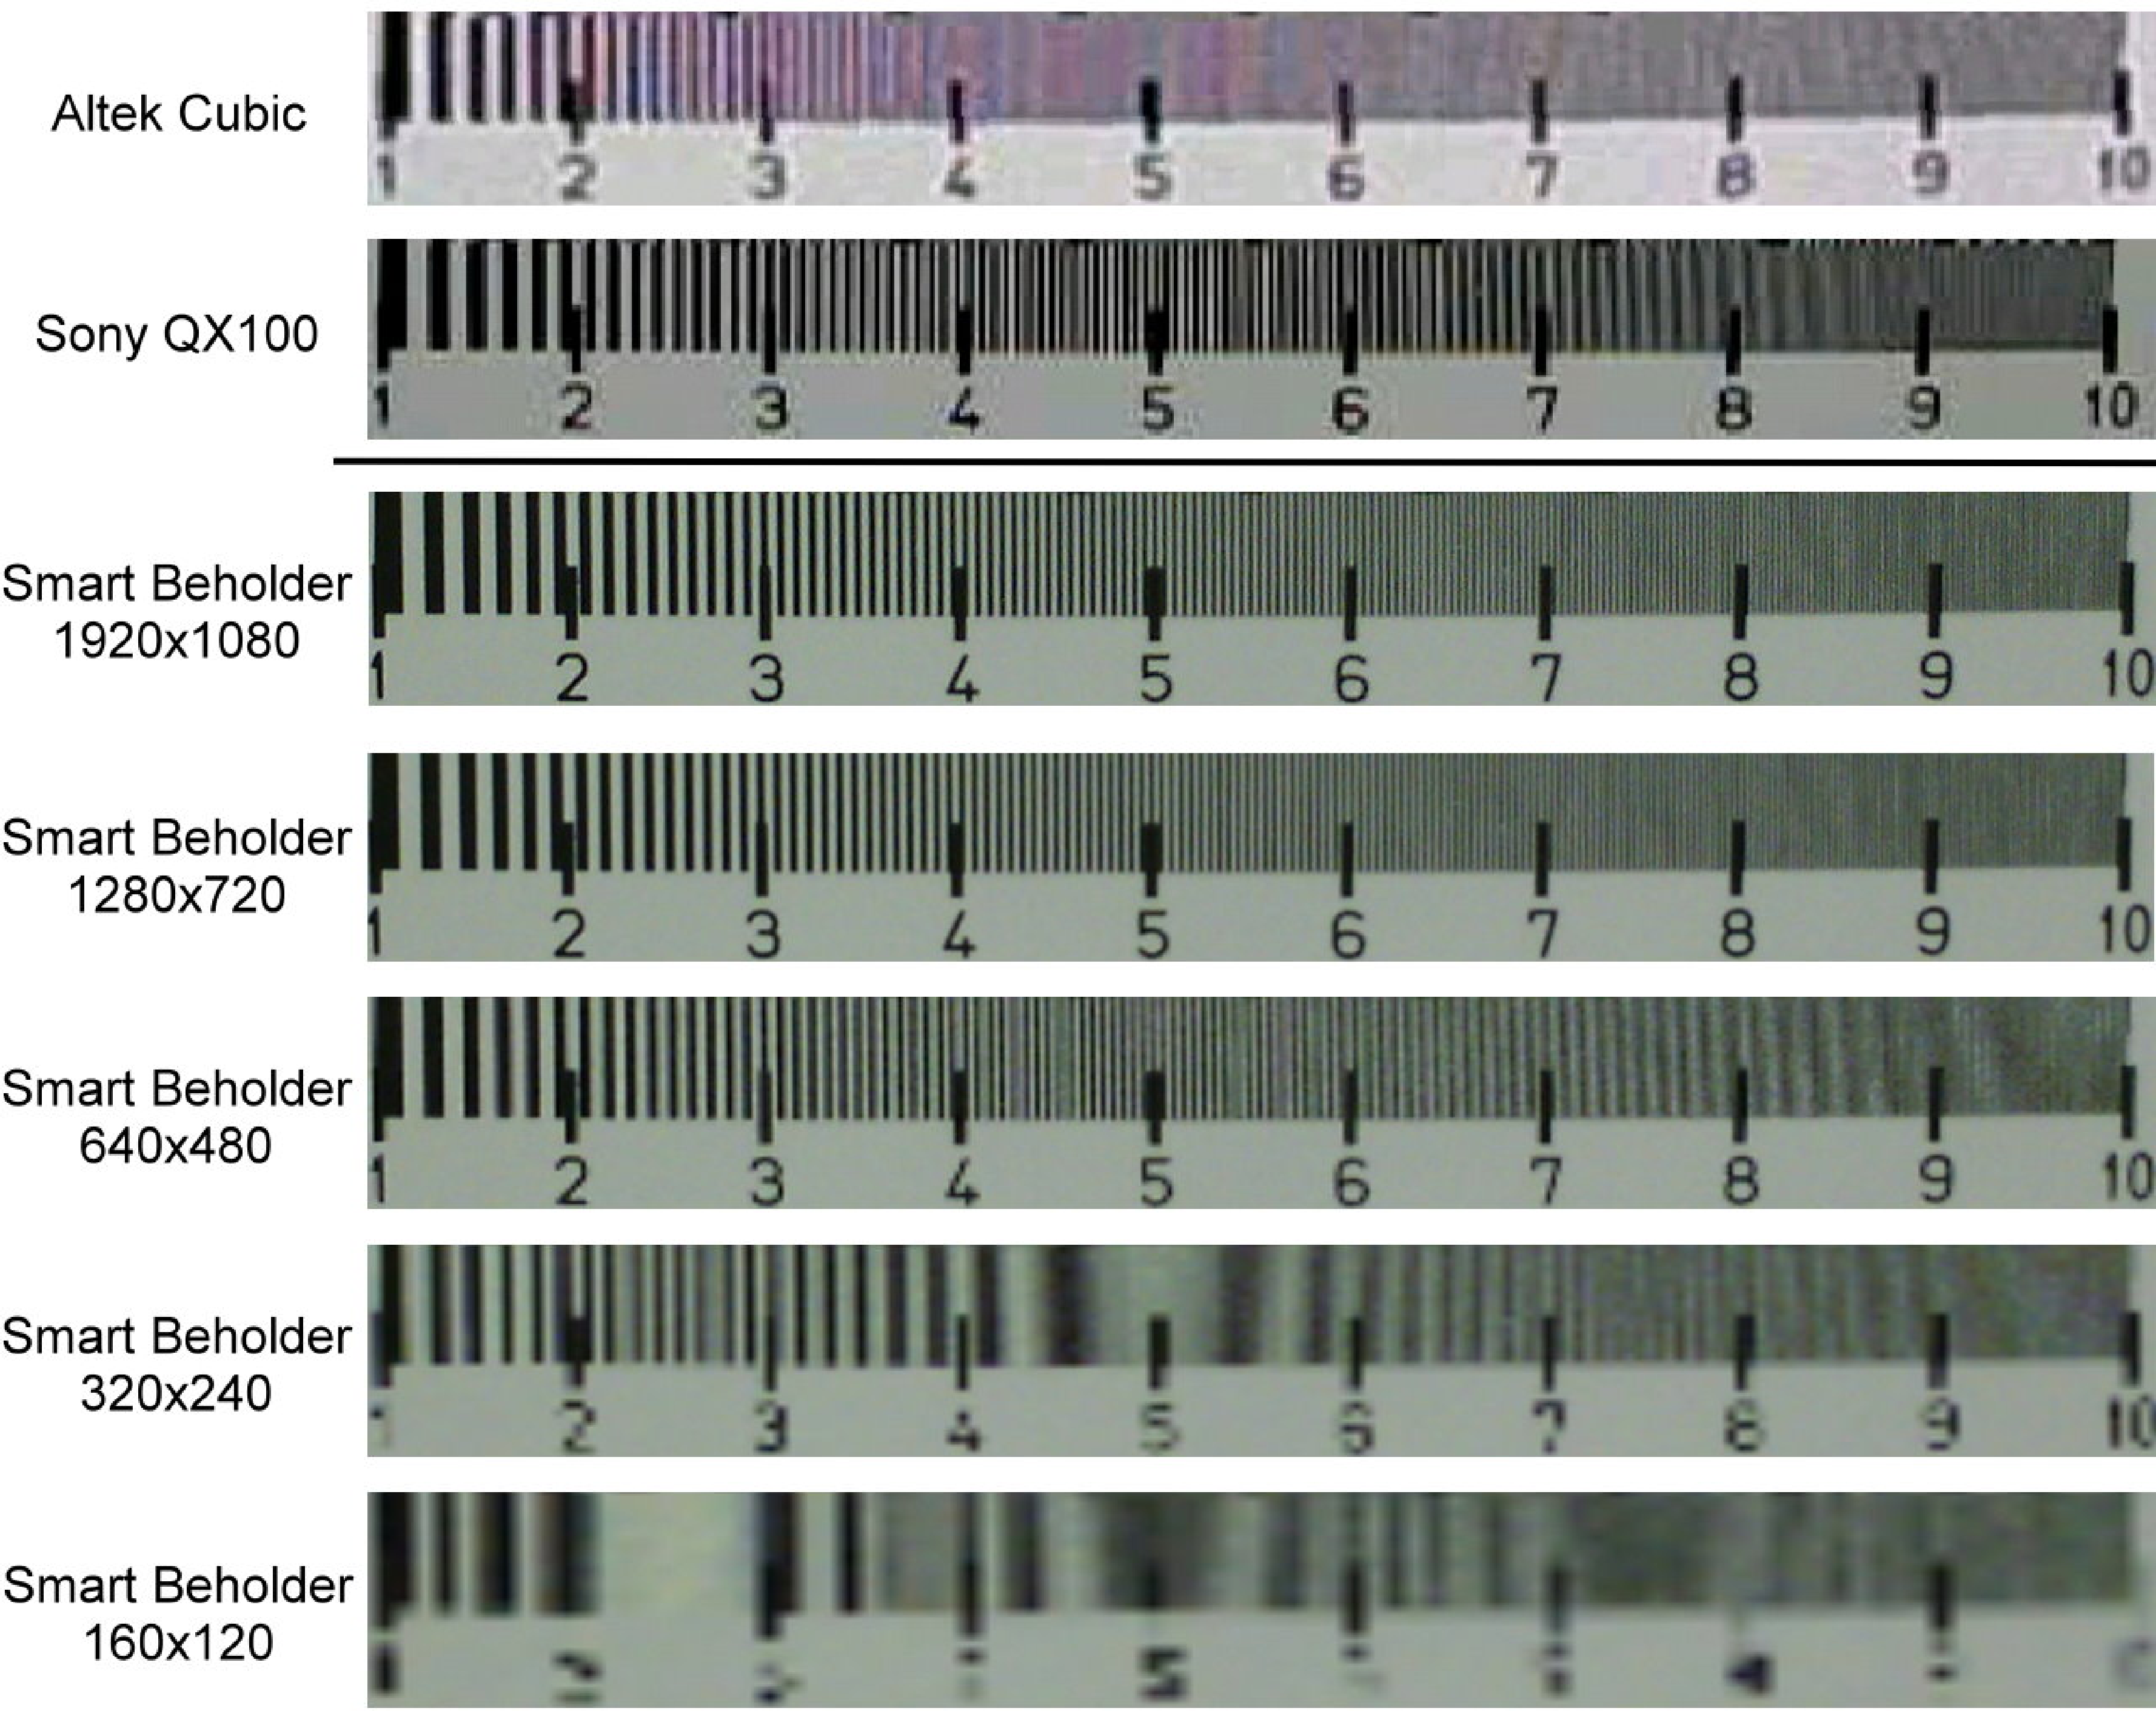
Figure 9: Live preview screenshots of line intensity testing region on
the resolution test chart.
Table 3: Considered Smart Lenses
Altek Cubic
Sony QX100
Smart Beholder
Model
Altek Cubic C01
Sony DSC-QX100
Raspberry Pi Model
B
Image
Resolution
2 MP (1600x1200)
13 MP (4160x3120)
5 MP (2592x1944)
18 MP (4864x3648)
5 MP (2592x1944)
Video
Resolution
1920x1080 @ 30 fps
1920x1080 @ 30 fps
1920x1080 @ 30 fps
8.1 Preview Resolutions of Commercial Smart Lenses
We consider two commercial smart lens products: Altek Cubic and Sony
QX100. They both offer in-house mobile apps on Android devices.
Figure 7 shows the three smart lenses and
Table 3 presents their specifications. Our Smart Beholder is
fully configurable, and supports different preview resolutions. The two
commercial products only support fixed preview resolutions,
which is unknown to users.
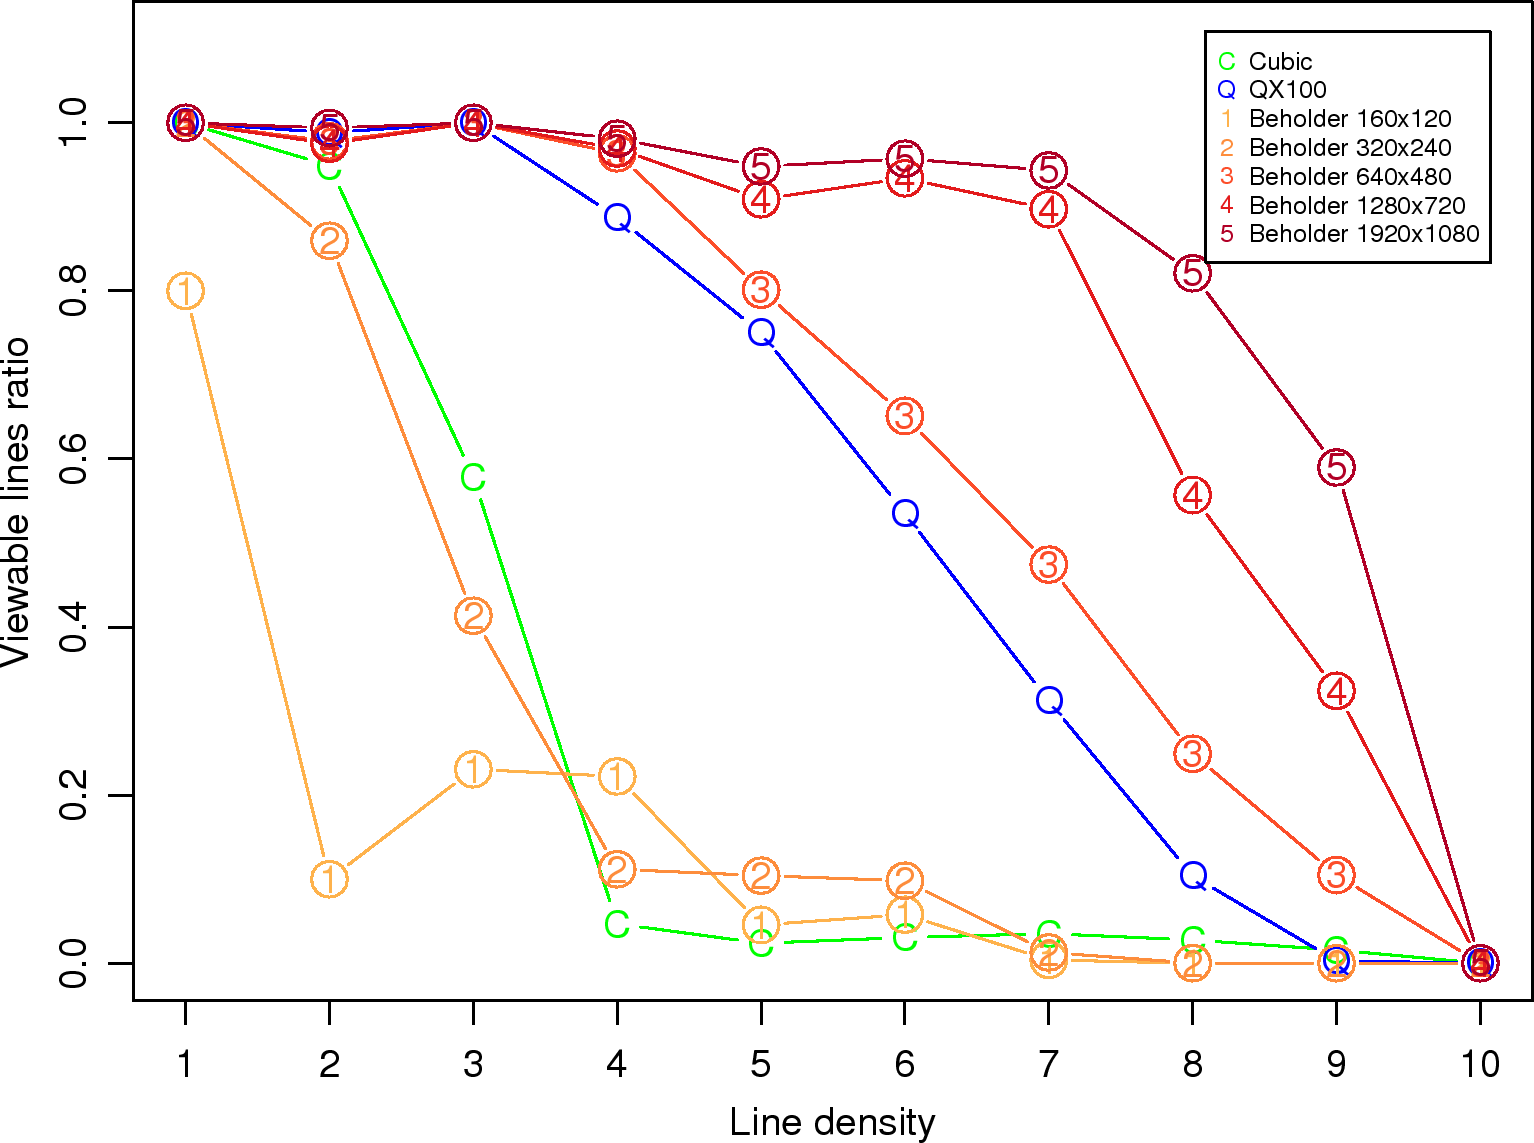
Figure 10: Viewable line ratios of different smart lenses under diverse
line densities.
We use a PIMA/ISO 12233 Resolution Test Chart [10] to infer the
preview resolutions. The experiment setup is presented in
Figure 8. We place the smart lens about 30
centimeters away from the test chart, so that the test chart on
viewfinder approximately spans the viewable area, and stream preview
videos to the tablet on the right. We use only the lower-middle part of
the test chart, where 10 numbered blocks with vertical lines in
different densities (and widths) are arranged into a row. The block
numbers indicate how dense these vertical lines are: from 1 (fewest,
thickest lines) to 10 (most, thinnest lines), and we refer to the block
number as line density. To count the number of lines in blocks
with higher line densities, video previews with higher resolutions are
needed. We define viewable line ratio as the fraction of
distinguishable vertical lines over all vertical lines in the test
chart.
Figure 11: Testbed setup.
Figure 12: Experimental procedure.
We then execute the following experiments with Altek Cubic, Sony QX100,
and Smart Beholder under 5 different resolutions. For each smart lens (and
resolution), we take screenshots of the live preview of the resolution
test chart and crop the line intensity testing region, as shown in
Figure 9. We then convert the regional
screenshots to binary (black and white) using the threshold 128 (with
the gray levels ranging from 0 to 255) and programmatically count the
numbers of vertical lines in individual blocks (from 1 to 10) in the
video previewers in order to calculate the viewable line ratios. We plot
the results in Figure 10. This figure shows that Altek
Cubic and Sony QX100 achieve very similar viewable line ratios over
different line densities as Smart Beholder at 320x240 and 640x480 resolutions,
respectively. Hence, we conclude that the preview resolutions of these
two commercial products are approximately 320x240 and 640x480,
respectively. Even though the quality of camera lenses may be very
different, we believe that the (relatively low) resolutions of preview
video would dominate how distinguishable the thin lines are.
8.2 Setup
We create two video/image datasets for objective and subjective
performance metrics. For objective metrics, we use a Canon EOS 600D
camera to capture eight segments of 25-sec videos at 720p. Half of the
segments are taken indoor (outdoor); and all segments are taken under
typical smart lens usage scenarios. We concatenate eight segments into a
216-sec video, in which we insert a 2-sec white screen between any two
consecutive videos to reset the video codecs for minimum interference
across videos. This dataset represents typical viewfinder previews, and
are suitable for objective metrics. It is, however, less suitable for
subjective metrics due to the relatively low resolution. For
subjective metrics, we collect 9 high-resolution (1080p) popular Creative
Commons (CC) photos from Flickr. We play each photo for 10 seconds, and
record the viewfinder previews using different smart lenses.
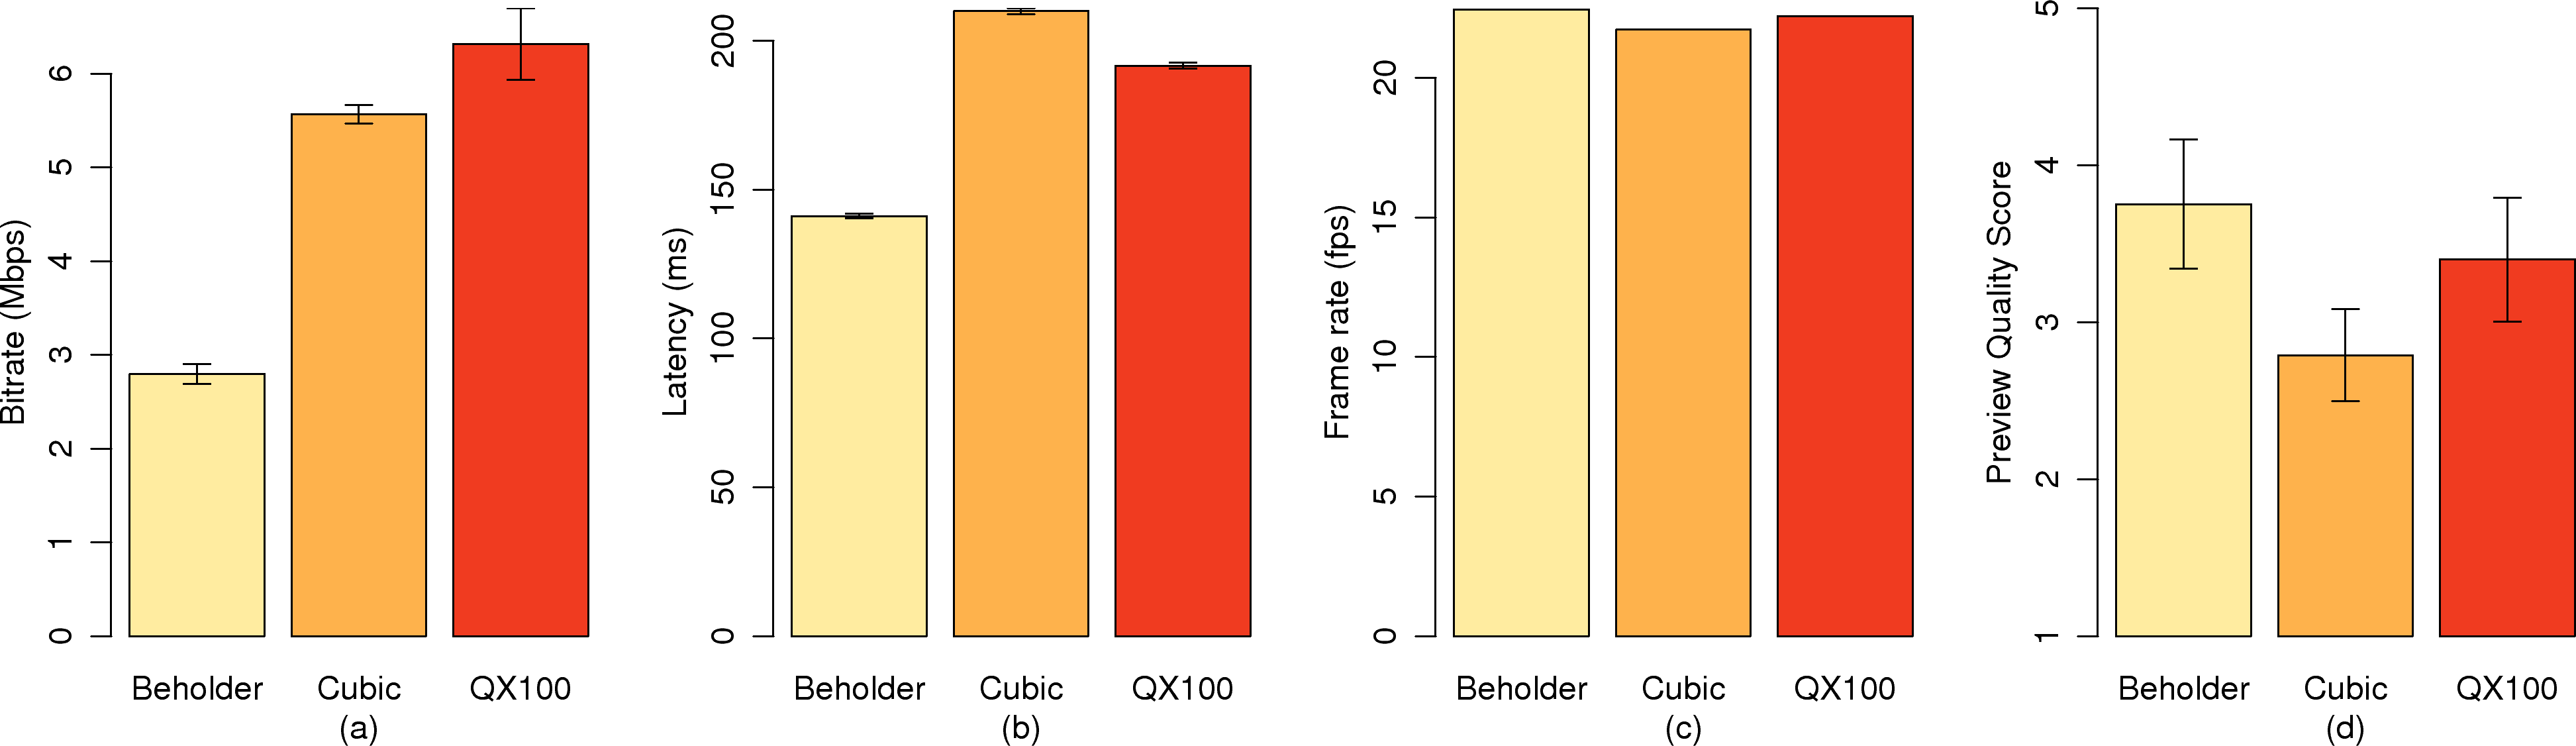
Figure 13: Overall performance comparisons among smart lenses: (a) bitrate, (b)
latency, (c) frame rate, and (d) preview quality.
Figure 11 shows the testbed used in our lab. We play
the videos on the video source display on the right, put a Smart Beholder (or
other smart lenses) server in front of the video source display, and send
the previews to the corresponding smart lens client running on a tablet
(Sony Xperia). The server and mobile client have a distance of 1 meter.
The tablet is connected to an external monitor on the left. Last, we use
a Canon EOS 600D camera to capture the videos of the two side-by-side
displays at 60 fps. The captured video is then used to derive
performance results. We also run tcpdump on the tablet to
capture and calculate the transmitted bitrate.
Figure 12 summarizes the measurement procedure.
For a subjective evaluation of preview quality, we conduct a
crowdsourcing-based user study over the Internet via web interface. We
present the original images (from Flickr) on the left half of the web
page, and the degraded images (extracted from the viewfinder previews)
on the right half. For each comparison, a subject gives a DMOS
(Differential Mean Opinion Score) between 0 (un-degraded) and 6
(seriously degraded and unacceptable). We convert the DMOS score to an
MOS score by MOS = 7−DMOS and use the resulting MOS score to be the
image quality metric. We recruit 52 subjects and perform 117 sessions
with a total of 14,410 comparison rounds. The total study duration is 30
hours, where each session lasts for 15 minutes on average.
We consider the following performance metrics:
Bitrate, which is the number of bits sent from the server to
mobile client every second.
Latency, which is the delay between capturing and displaying
a video frame on mobile client.
Frame rate, which is the number of frames rendered at mobile
client every second.
Energy consumption, which is the amount of consumed energy.
Preview quality, which is the MOS score. We focus on
previews, because final images/videos are either saved on smart lenses, or
transferred to mobile clients in batches at very high quality.
The first four metrics are objective and the last one is subjective.
We give mean results with 95% confidence intervals if
applicable.
8.3 Results
We first present the results with static Smart Beholder configurations, which are
followed by the results with preview adaptation algorithm enabled.
Smart Beholder outperforms other smart lenses.
We plot the overall performance in Figure 13.
Figure 13(a) shows that Smart Beholder consumes as low as half of the
bitrate compared to commercial smart lenses. This conforms to our
expectation as we configure Smart Beholder to use an average bitrate of 3 Mbps.
Figure 13(b) reveals that Smart Beholder results in at least 50
ms shorter latency, which in turn leads to more responsive user
experience. Figure 13(c) depicts that our Smart Beholder
achieves comparable, actually slightly higher, frame rate than the two
commercial smart lenses. In summary, the Smart Beholder outperforms the two
commercial products in all considered objective performance metrics.
We report the preview image quality in Figures 13(d), which
shows that our Smart Beholder achieves better
MOS scores than two commercial smart lenses.
More importantly, such higher preview quality does not come with higher
network nor system loads as Figures 13(a)
and 13(b) show.
Table 4: The System Parameters
Parameter
Values
Frame Rate
6 fps, 12 fps, 24 fps
Resolution
160x120, 320x240, 640x480, 1280x720, 1920x1080
Bitrate
1 Mbps, 2 Mbps, 3 Mbps
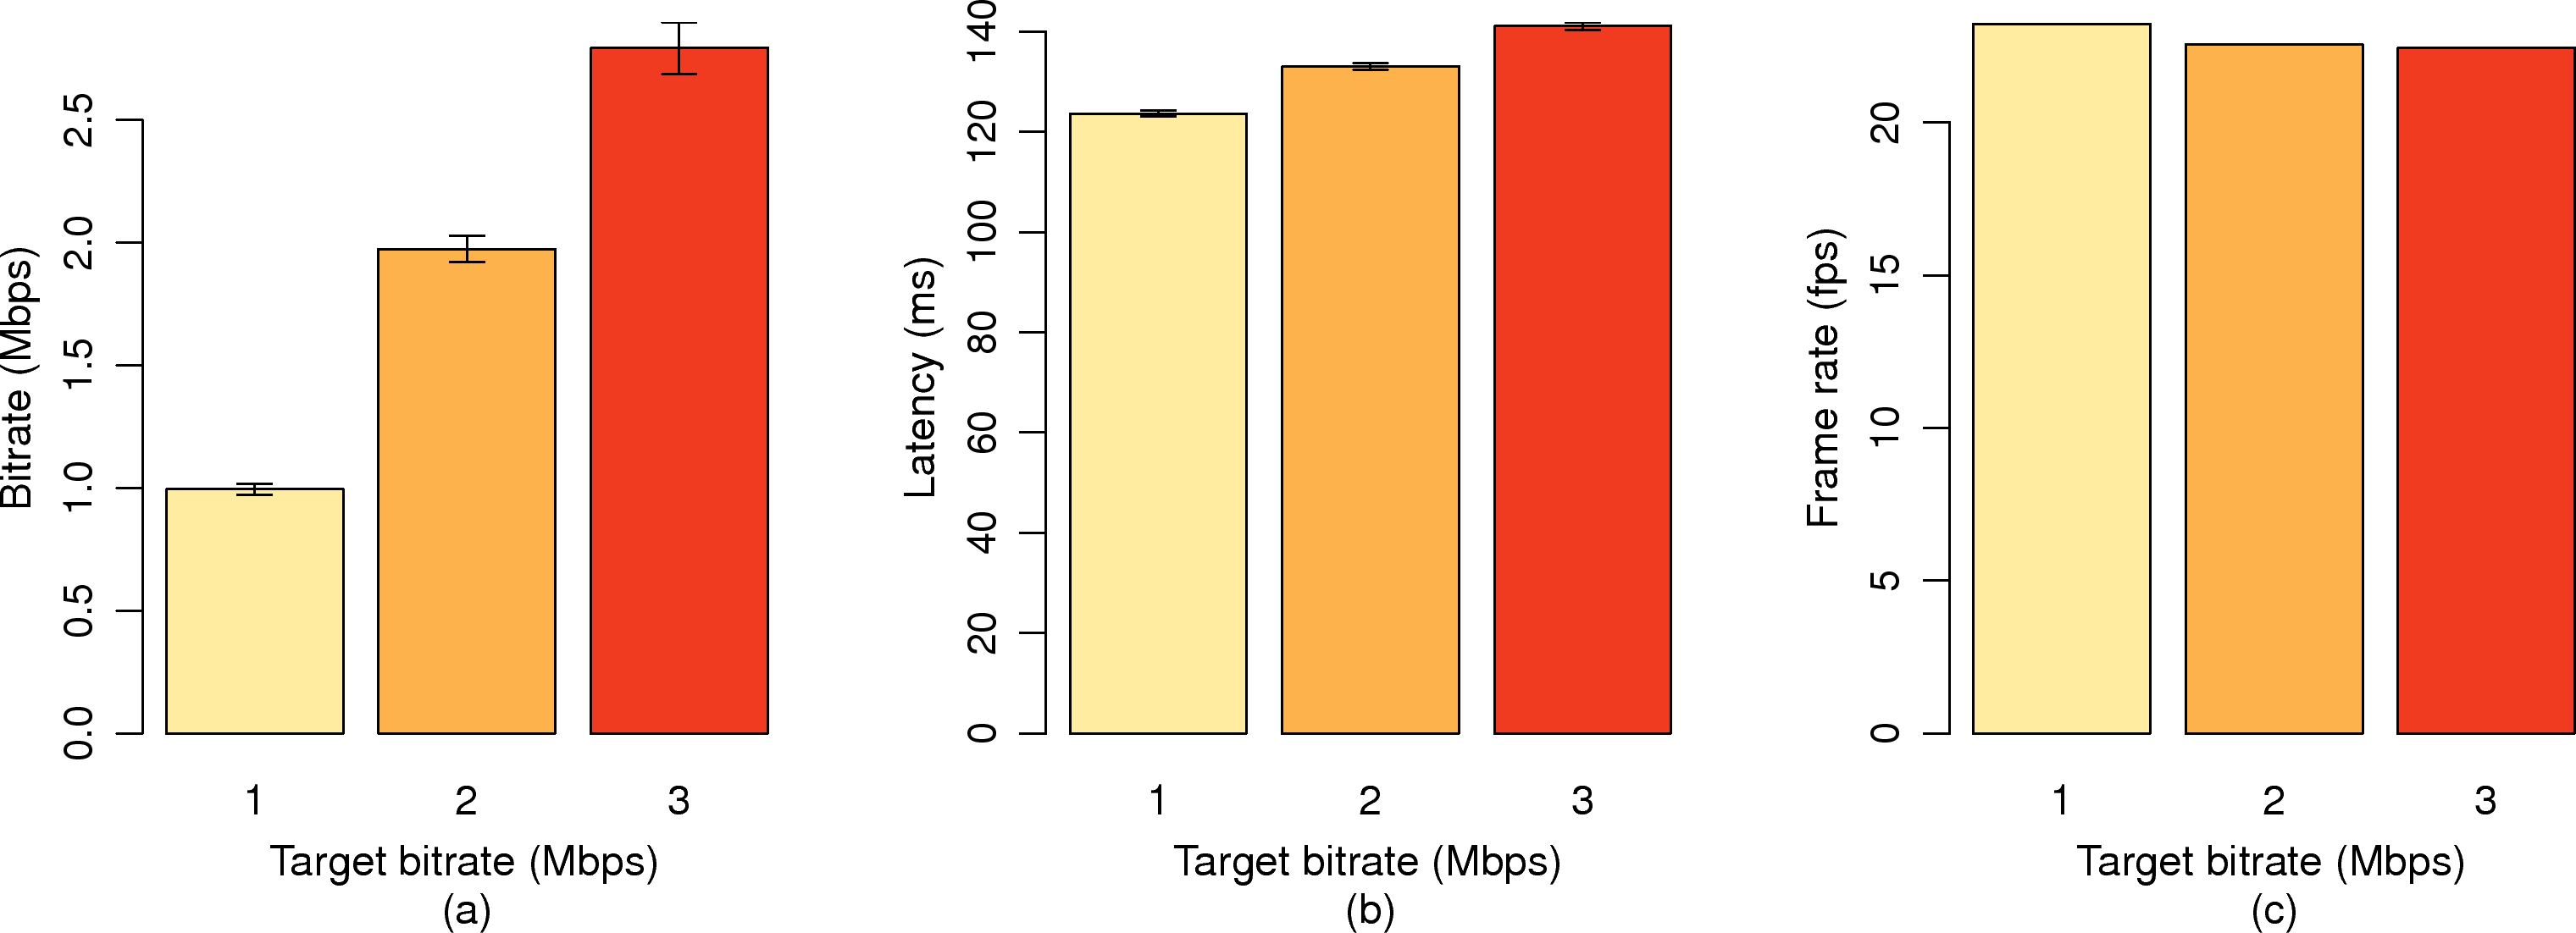
Figure 14: Beholder performance with different target bitrates: (a)
achieved bitrate, (b) latency, and (c) frame rate.
Configurability of Smart Beholder. We vary the configurations of Smart Beholder following
the parameter values in Table 4 with the default values
highlighted in boldface. With each configuration, we measure the system
performance using the 216-sec preview video. Two sets of sample results are
given below. First, we adjust the target encoding bitrates and present the
results in Figure 14. This figure depicts that when the
target bitrate is increased, the achieved bitrate
(Figure 14(a)) and the latency
(Figure 14(b)) increase, while the frame rate
(Figure 14(c)) slightly decreases. We believe the slightly
increased latency and slightly decreased frame rate is due to a higher
complexity and workload in decoding the preview videos at the client.
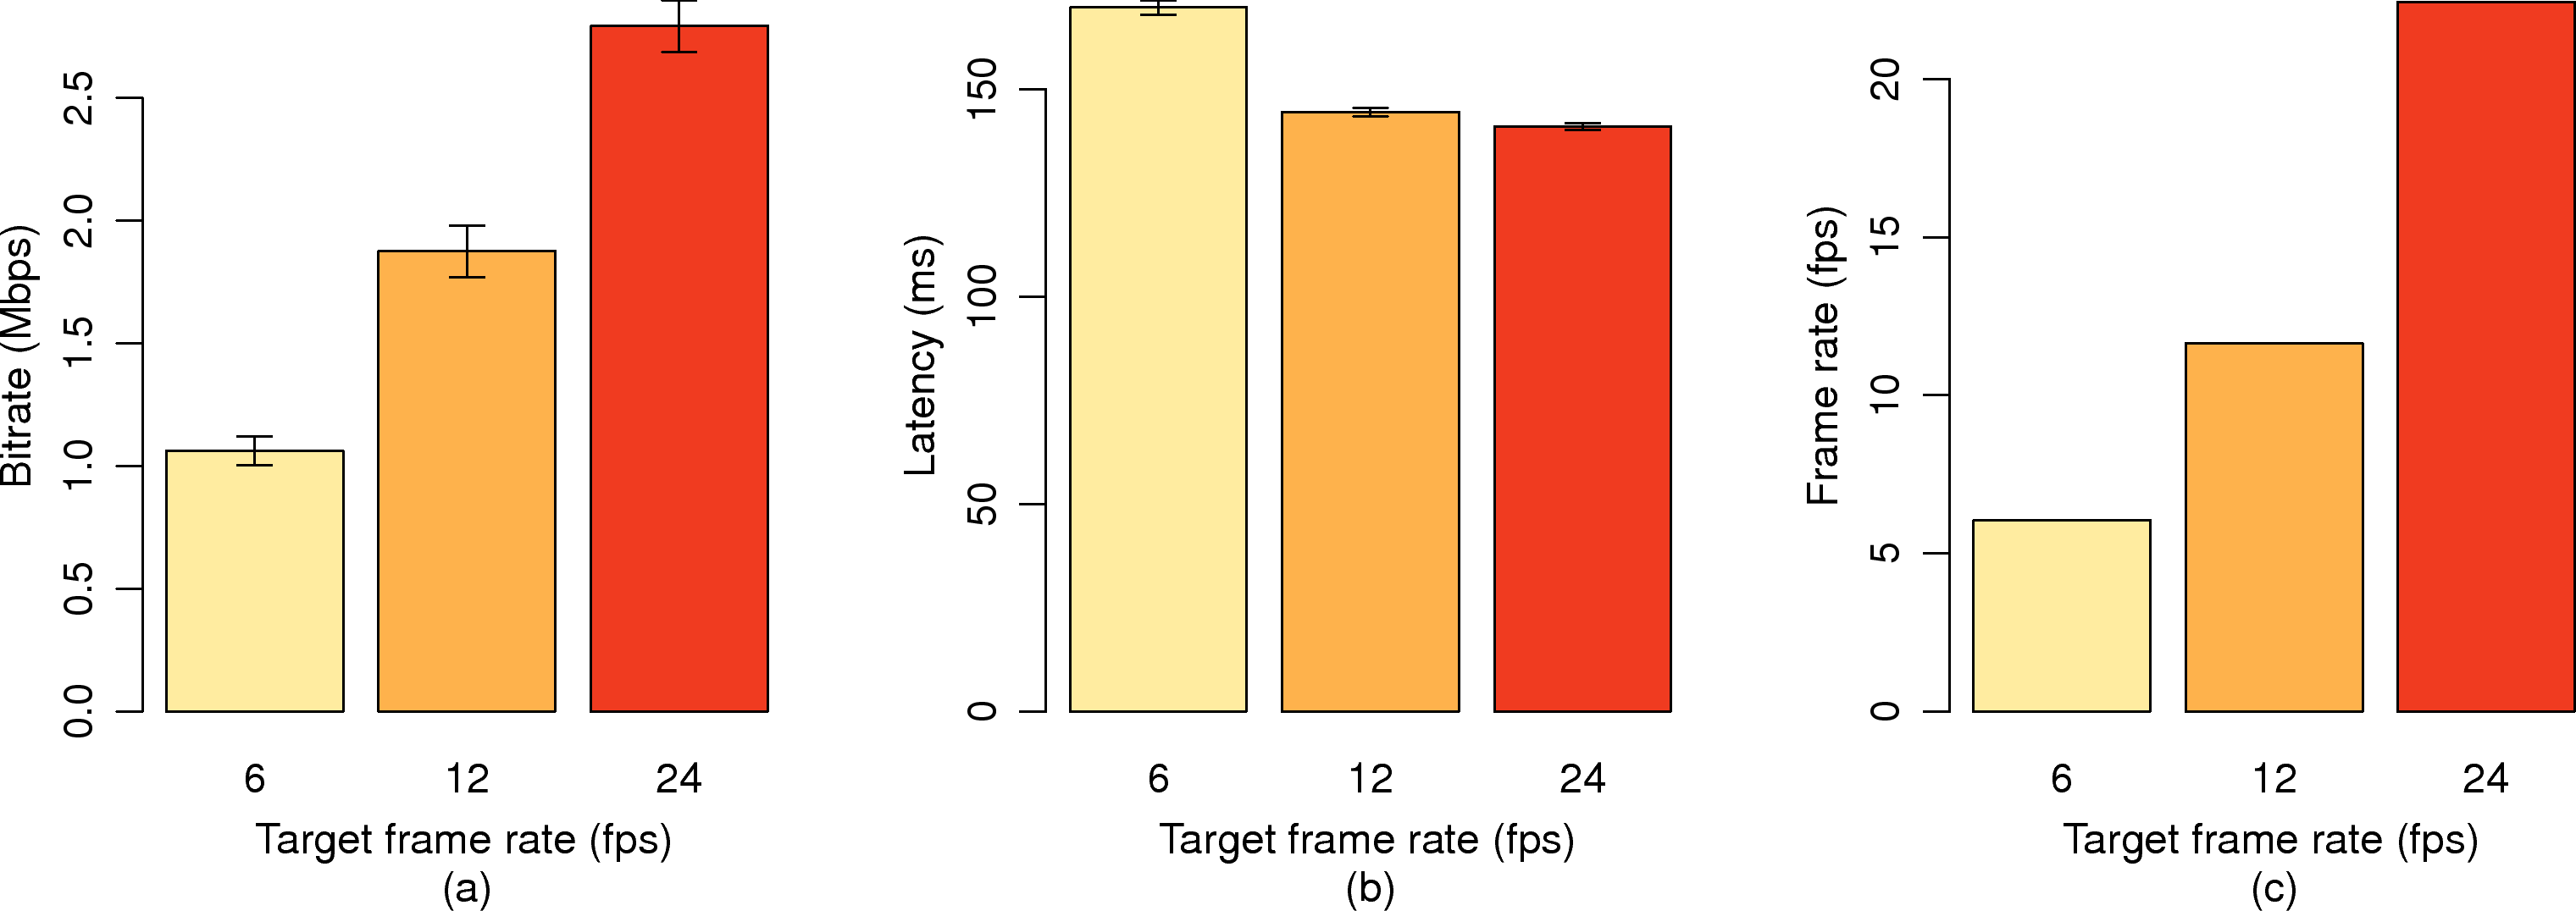
Figure 15: Beholder performance under different target frame rates: (a)
bitrate, (b) latency, and (c) frame rate.
Next, we adjust the target frame rate and give the results in
Figure 15. Figure 15(c) shows that Smart Beholder
always achieves the target frame rates, which reveals the efficiency of its
implementation. Figures 15(a) and
15(b) show that higher target frame rates lead to higher
bitrate and lower latency, which are consistent with our intuition, as a 6 fps live
preview incurs at least 1000 ms÷6 ≈ 166 ms latency.
In summary, Figures 14 and
15 demonstrate the configurability of our
implementation.
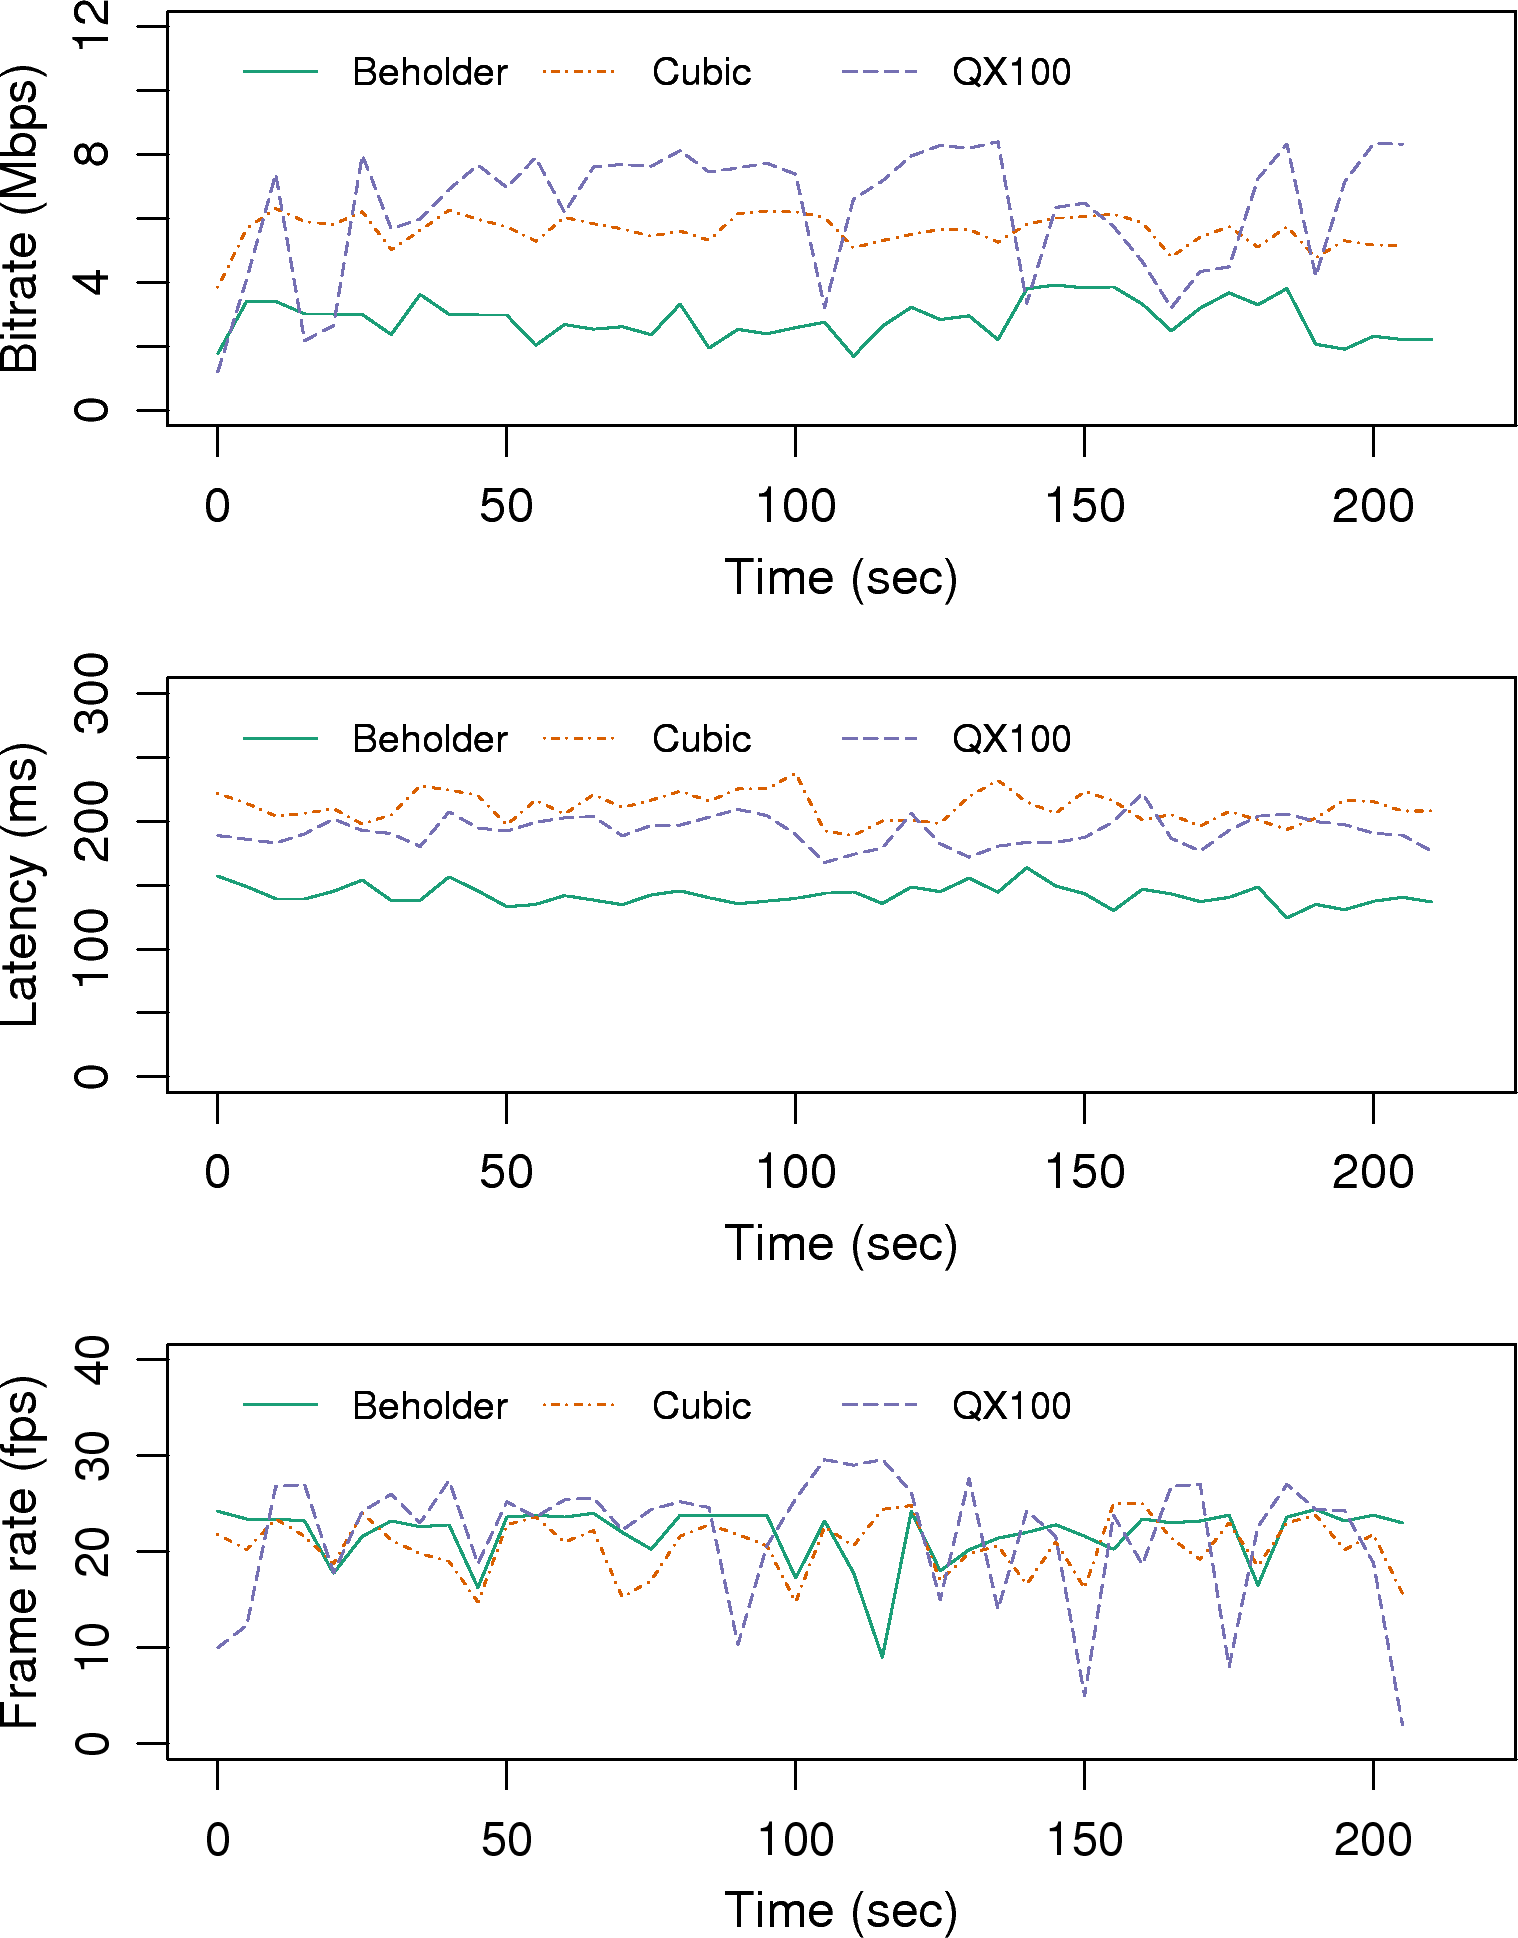
Figure 16: Needs of adaptation algorithm: (a) bitrate, (b)
latency, and (c) frame rate over time.
Needs of adaptation algorithm.
We zoom into a sample run of the 216-sec video, and
report the per-second bitrate, latency, and frame rate in
Figure 16. Figures 16(a) and
16(b) show that Smart Beholder constantly results in low bitrate
and low latency compared to the two commercial smart lenses.
Figure 16(c) shows that Sony QX100 suffers from severe
frame rate drops at 150-th, 175-th, and 205-th seconds, due to bad network conditions. Smart Beholder also
suffers from a frame rate drop at 110-th second, which demonstrates the needs of
preview adaptation algorithm.
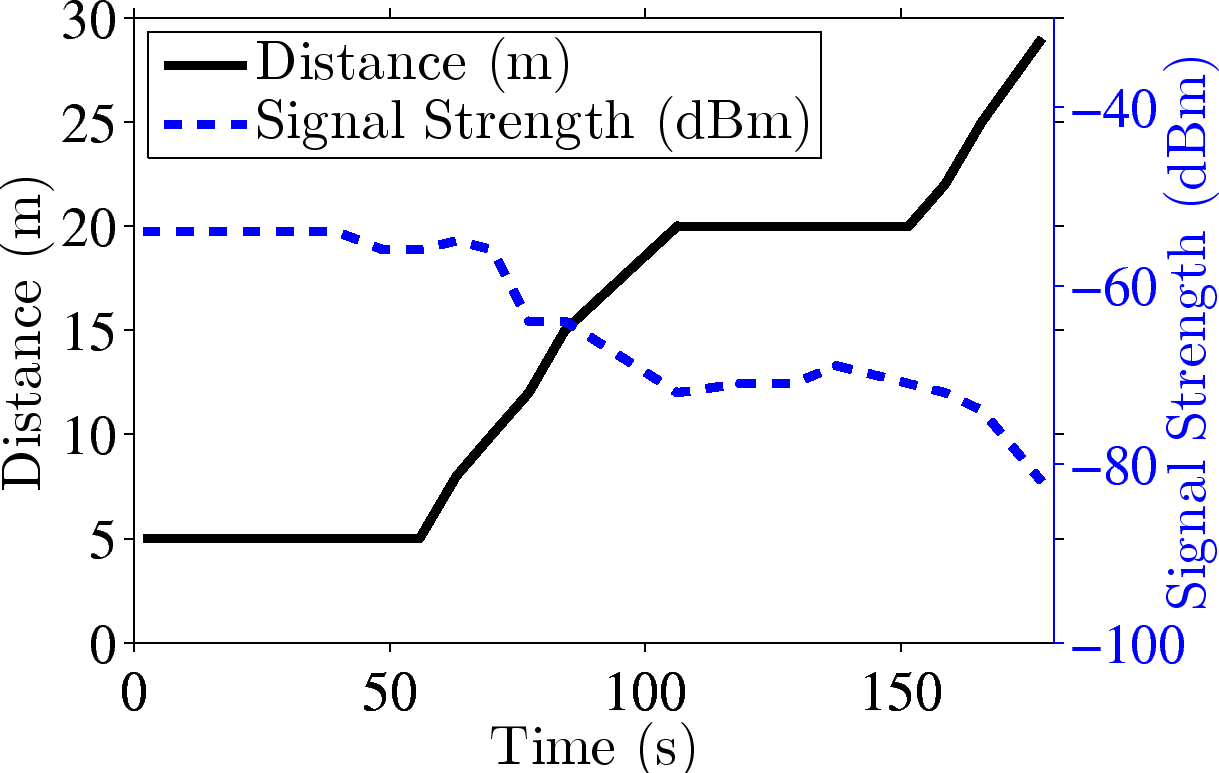
(a)
(b)
Figure 17: A sample of 3-minute experiment: (a) distance affects signal strength and (b) reconfiguration (bitrate) decisions are driven by capacity estimation.
Effectiveness of preview adaptation algorithm. We conduct experiments to
quantify the performance of our proposed preview
adaptation algorithm. We fix the position of the server and move the client
following a 3-minute moving pattern of distance from 5 to 30 m, while configuring
Smart Beholder to record the signal strength, capacity, and bitrate. We
plot the results in Figure 17.
Figure 17(a) shows that the signal strength is inversely
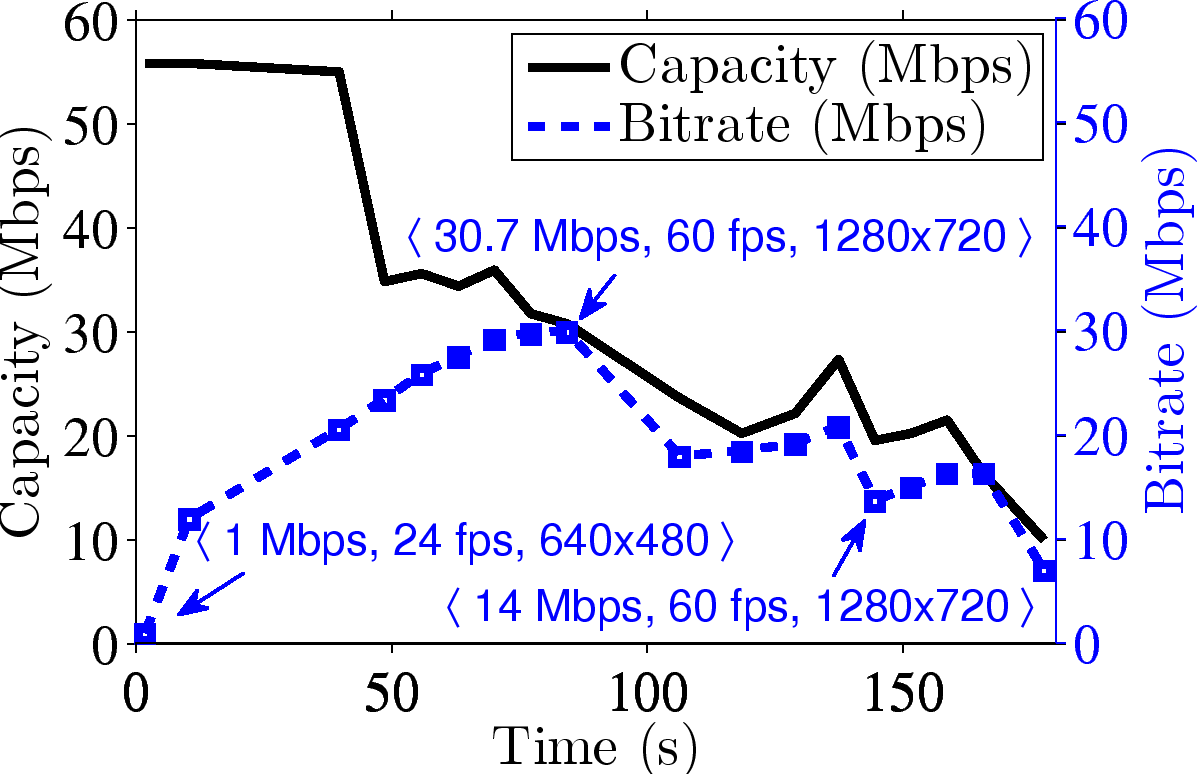
proportional to the distance, which is inline with our intuition. At the beginning of the
experiment, we set the configuration to be 〈1 Mbps, 24 fps, 640x480〉, and trigger the
adaptation algorithm once every 10 seconds. Figure 17(b) shows
the estimated capacity and the sample bitrate decisions of our adaptation algorithm
throughout the experiment. The capacity decreases with the decreasing signal
strength. At 140-th second, the signal strength increases a little because
the client stays at 20 meters for a while, which makes the network condition
more stable. The adaptation algorithm increases the encoding bitrate until it
approaches the estimated capacity (at 70-th second). At that moment, our algorithm
reconfigures f to 60 fps and r to 1280x720 for the highest MOS score based on the QoE model (Section 7.2). Several
other reconfiguration samples are also annotated in Figure 17(b).
Last, we note that the resulting bitrate may be lower than the
configured bitrate, e.g., at f=60 fps and r= 1280x720, the highest resulting
bitrate is 9 Mbps in our experiments.
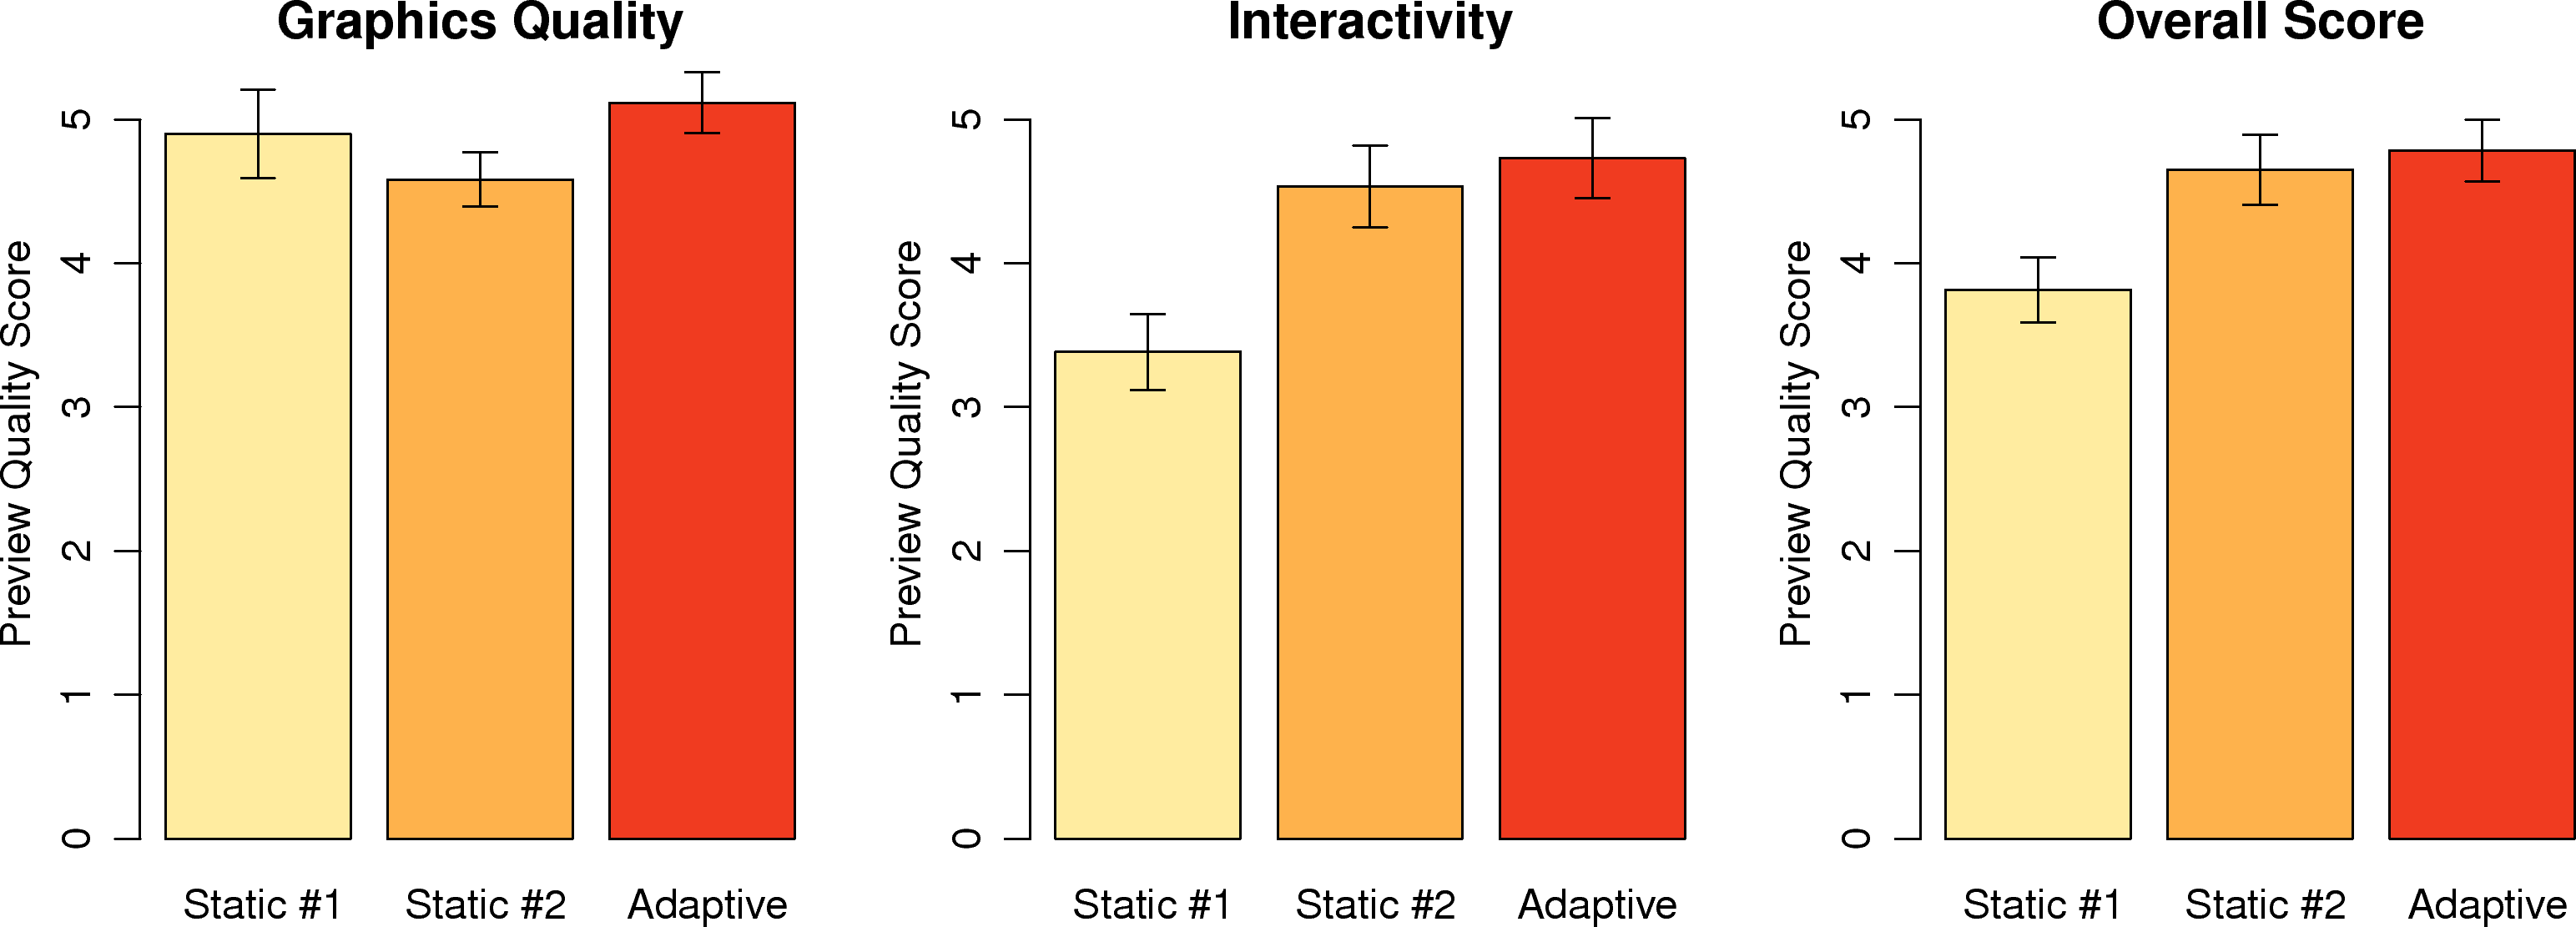
Figure 18: MOS scores of different configurations and preview adaptation algorithm.
We next conduct a user study for a subjective evaluation on the preview
adaptation algorithm. We compare our algorithm against two configurations: static #1,
which is 〈2 Mbps, 10 fps, 864x480〉; and static #2, which is
〈0.5 Mbps, 30 fps, 544x288〉. We recruit 12 subjects and
carry out 60 sessions in total. In each session, we randomly select a
configuration and ask the subject to use Smart Beholder for at most 3 minutes, and then score the preview quality. 8 subjects think
static #1 outperforms static #2 in graphics quality , and 10 subjects feel
static #2 outperforms static #1 in interactivity. Overall, majority of
subjects prefer our preview adaptation algorithm, as summarized in
Figure 18. Figures 17 and
18 reveal the effectiveness of our preview adaptation
algorithm in both objective and subjective metrics.
Energy efficiency.
We encode the 216-sec preview video at different frame rates using software and
hardware encoders on Raspberry Pi. We repeat each experiment 3 times
and clear cache each time for fair comparisons.
The average results reported in Table 5 show that using hardware encoder
saves at least 86.5% in energy compared to using software encoder.
In addition, we use PowerTutor [27] to measure the per-application energy consumption
of Smart Beholder client running on an HTC One X. PowerTutor is a popular measurement tool for energy
consumption on Android devices. Smart Beholder client averagely consumes about 0.97 W and the LCD display
alone is responsible for 0.89 W. This shows that Smart Beholder client is energy efficient.
Table 5: The Energy Consumption of Beholder Server
Frame Rate
S/W Encoder
H/W Encoder
Saving of H/W Encoder
30 fps
883.44 J
104.98 J
88.1 %
20 fps
530.06 J
71.50 J
86.5 %
15 fps
421.63 J
42.55 J
89.9 %
10 fps
304.78 J
28.51 J
90.6 %
5 fps
176.04 J
18.36 J
89.6 %
9 Conclusion
In this paper, we have proposed an open-source smart lens platform
called Smart Beholder, which is designed with three objectives in mind:
cost effectiveness, low latency, and high preview quality.
We have designed, implemented, and evaluated Smart
Beholder using off-the-shelf components. Several optimization techniques
have been proposed and implemented in this paper. We have compared the
performance of Smart Beholder against two commercial smart lens
products, and we have found that Smart Beholder
achieves lower bitrate, lower latency, slightly higher
frame rate, and better preview quality. Our measurement methodology
presented in this paper is useful when more commercial smart lenses hit
the market. More importantly, since Smart Beholder is an open-source project, it
can be leveraged by researchers and developers for real experiments to
quantify the performance resulted by different design alternatives. We
believe that Smart Beholder will lead to optimized smart lenses and
other real-time video streaming systems in the future.
Acknowledgements
This work was partially supported by the Ministry of Science and Technology of Taiwan under the grants: 103-2221-E-019-033-MY2, 103-2221-E-019-033-MY2, and 102-2221-E-007-062-MY3.
References
[1]
5 areas where cameras still beat smartphones if you want great photo quality.
http://tinyurl.com/n8f5w8d">http://tinyurl.com/n8f5w8d.
[2]
Altek Cubic: Perfect to selfies.
http://www.altek.com.tw/cubic/">http://www.altek.com.tw/cubic/.
[3]
Banana pi, 2014.
http://www.bananapi.org/">http://www.bananapi.org/.
[4]
R. Baratto, L. Kim, and J. Nieh.
Thinc: a virtual display architecture for thin-client computing.
In Proc. of ACM Symposium on Operating Systems Principles,
(SOSP '05), pages 277-290, Brighton, UK, Oct 2005.
[5]
S. Chandra, J. Boreczky, and L. Rowe.
High performance many-to-many Intranet screen sharing with
DisplayCast.
ACM Transactions on Multimedia Computing, Communications, and
Applications, 10(2):19:1-19:22, Feb 2014.
[6]
Y. Chang, P. Tseng, K. Chen, and C. Lei.
Understanding The Performance of Thin-Client Gaming.
In Proc. of IEEE International Conference on Communications
Quality and Reliability Workshop (CQR'11), pages 1-6, Naples, FL, May 2011.
[7]
K. Chen, Y. Chang, H. Hsu, D. Chen, C. Huang, and C. Hsu.
On The Quality of Service of Cloud Gaming Systems.
IEEE Transactions on Multimedia, 16(2):480-495, Feb 2014.
[8]
M. Claypool, D. Finkel, A. Grant, and M. Solano.
Thin to win? network performance analysis of the OnLive thin client
game system.
In Proc. of ACM Workshop on Network and Systems Support for
Games (NetGames'12), pages 1-6, Venice, Italy, Nov 2012.
[9]
D. Z. Cook.
Advanced Dungeons & Dragons-Player's Handbook.
TSR, 1989.
[10]
Digital camera resolution test procedures.
http://www.gpsinformation.org/jack/photo-test/pics/lens-tests.html">http://www.gpsinformation.org/jack/photo-test/pics/lens-tests.html.
[11]
DSC-QX100 lens-style camera with 1.0-type sensor.
http://www.sony.co.uk/electronics/cyber-shot-compact-cameras/dsc-qx100">http://www.sony.co.uk/electronics/cyber-shot-compact-cameras/dsc-qx100.
[12]
M. Farooq and T. Kunz.
Wireless multimedia sensor networks testbeds and state-of-the-art
hardware: A survey.
In Communication and Networking, volume 265 of
Communications in Computer and Information Science, pages 1-14. Springer
Berlin Heidelberg, 2012.
[13]
Gaikai web page.
http://www.gaikai.com/">http://www.gaikai.com/.
[14]
Global digital camera market decline slowing down in 2014, predicts new report.
http://iphone.tmcnet.com/news/2014/02/07/7667425.htm">http://iphone.tmcnet.com/news/2014/02/07/7667425.htm.
[15]
M. Halpern and L. Humphreys.
Iphoneography as an emergent art world.
SAGE New Media and Society, 2014.
[16]
Y. He, K. Fei, G. Fernandez, and E. Delp.
Video quality assessment for Web content mirroring.
In Proc. of Imaging and Multimedia Analytics in a Web and Mobile
World, pages 90270C-1-90270C-8, San Francisco, CA, Mar 2014.
[17]
H. Hong, C. Hsu, T. Tsai, C. Huang, K. Chen, and C. Hsu.
Enabling Adaptive Cloud Gaming in an Open-Source Cloud Gaming Platform.
IEEE Transactions on Circuits and Systems for Video Technology,
Jun 2015.
Accepted to appear.
[18]
C. Hsu, T. Tsai, C. Huang, C. Hsu, and K. Chen.
Screencast Dissected: Performance Measurements and Design Considerations In Proc. of ACM Conference on Multimedia Systems (MMSys'15),
pages 177-188, Portland, OR, Mar 2015.
[19]
C. Huang, K. Chen, D. Chen, H. Hsu, and C. Hsu.
GamingAnywhere: The First Open Source Cloud Gaming System.
ACM Transactions on Multimedia Computing, Communications, and
Applications, 10(1):36-47, Jan 2014.
[20]
R. Kapoor, L. Chen, L. Lao, M. Gerla, and M. Y. Sanadidi.
Capprobe: A simple and accurate capacity estimation technique.
In Proc. of SIGCOMM'04, pages 67-78, Portland, OR, Aug 2004.
[21]
H. Lagar-Cavilla, N. Tolia, E. de Lara, M. Satyanarayanan, and D. O'Hallaron.
Interactive resource-intensive applications made easy.
In Proc. of the ACM/IFIP/USENIX International Conference on
Middleware (Middleware'07), pages 143-163, Newport Beach, CA, Nov 2007.
[22]
A. Lai and J. Nieh.
On the performance of wide-area thin-client computing.
ACM Transactions on Computer Systems, 24:175-209, May 2006.
[23]
D. M. Leenaerts and W. M. V. Bokhoven.
Piecewise linear modeling and analysis.
Kluwer Academic Publishers, 1998.
[24]
M. Li, M. Claypool, and R. Kinicki.
Wbest: a bandwidth estimation tool for ieee 802.11 wireless networks.
In Proc. of IEEE Conference on Local Computer Networks
(LCN'08), pages 374-381, Montreal, Canada, Oct 2008.
[25]
Linux UVC driver and tools.
http://www.ideasonboard.org/uvc/">http://www.ideasonboard.org/uvc/.
[26]
OnLive web page, 2014.
http://www.onlive.com/">http://www.onlive.com/.
[27]
PowerTutor.
http://ziyang.eecs.umich.edu/projects/powertutor/">http://ziyang.eecs.umich.edu/projects/powertutor/.
[28]
V. Ribeiro, R. Riedi, R. Baraniuk, J. Navratil, and L. Cottrell.
Pathchirp: Efficient available bandwidth estimation for network
paths.
In Proc. of Passive and Active Monitoring Workshop (PAM'03),
volume 4, San Diego, CA, Apr 2003.
[29]
M. Richardson and S. Wallace.
Getting Started with Raspberry Pi.
Ö'Reilly Media, Inc.", 2012.
[30]
Sl10 smart lens camera sl10.
http://kodakcamera.jkiltd.com/Americas/cameras/smartlens/sl10.php">http://kodakcamera.jkiltd.com/Americas/cameras/smartlens/sl10.php.
[31]
N. Tolia, D. Andersen, and M. Satyanarayanan.
Quantifying interactive user experience on thin clients.
Computer, 39(3):46-52, 2006.
[32]
Ubitus web page.
http://www.ubitus.net">http://www.ubitus.net.
[33]
K. Wac.
Smartphone as a personal, pervasive health informatics services
platform: Literature review.
IMIA Yearbook 2012: Personal Health Informatics, 7(1):83-93,
2012.
[34]
Worldwide smartphone shipments top one billion units for the first time,
according to IDC.
http://www.idc.com/getdoc.jsp?containerId=prUS24645514">http://www.idc.com/getdoc.jsp?containerId=prUS24645514.
[35]
S. Yang, J. Nieh, M. Selsky, and N. Tiwari.
The performance of remote display mechanisms for thin-client
computing.
In Proc. of USENIX Annual Technical Conference (ATC'02), pages
131-146, Monterey, CA, Jun 2002.
[36]
S. Yoon, H. Oh, D. Lee, and S. Oh.
Virtual lock: A smartphone application for personal surveillance
using camera sensor networks.
In Proc. of IEEE International Conference on Embedded and
Real-Time Computing Systems and Applications (RTCSA'11), pages 77-82,
Toyama, Japan, Aug 2011.
Footnotes:
1. We note that the protocol overhead is considered in
our implementation when comparing [ˉc]α. p and ρ. We
omit this technical detail in our descriptions for brevity.
Sheng-Wei Chen (also known as Kuan-Ta Chen) http://www.iis.sinica.edu.tw/~swc
Last Update September 28, 2019


 (a)
(a)
 (b)
(b)


 (a)
(a)
 (b)
(b)